by r Hampton | Feb 26, 2019 | Tax News
Tax Policy – The Case for Universal Savings Accounts
Key Findings
- Personal saving and investment are necessary for long-term economic growth.
- Though the tax code provides several types of accounts that receive proper tax treatment for narrow saving purposes, their elaborate rules and restrictions complicate and discourage saving.
- The creation of universal savings accounts (USAs) would help people to save. USAs are all-purpose accounts available to anyone, with no minimum contribution requirements and no restrictions or penalties for withdrawals. They apply the proper tax treatment to saving, as they have only one level of taxation, at the time of either contribution or withdrawal.
- USA equivalents have been implemented in Canada and the United Kingdom, where they have encouraged saving and seen widespread usage across income groups.
- For policymakers in the United States designing USAs, details would include setting an annual contribution cap, adjusting contribution limits over time, and choosing between traditional- and Roth-style tax treatment.
Introduction
Saving and investment are essential to people’s long-term economic stability and the economy’s continued growth, but over the last half century they have declined dramatically in the United States. Today, many Americans are not saving enough to cover the country’s domestic investments or to respond to adverse financial conditions.[1] For example, four in 10 adults, if faced with a surprise $400 expense, would either be unable to pay for it or would have to sell something or borrow.[2]
Although the causes of and solutions to the decline of American saving are many, one step in the right direction would be the creation of universal savings accounts (USAs). USAs are simple, all-purpose accounts available to anyone, with no restrictions on either the timing or purpose of withdrawals. Savings are taxed only once, at the time of either contribution or withdrawal, and contributions are invested in assets such as bonds and equities, providing a return over time.
While savings options already exist in the U.S., many discourage saving because of complicated rules, additional levels of taxation, and regulations on when and for what purpose savings can be used. By avoiding the problems of other savings accounts, USAs could help Americans save and invest more today, making possible a more prosperous economy in the future.
Problems with Current Savings Accounts
Current savings options are flawed in two respects: many are not neutral, with multiple levels of taxation, and many have an intimidatingly complex set of rules and restrictions. These flaws encourage immediate consumption over saving, contributing to the low savings rate in the U.S.
Lack of Neutrality
When people save, they are purchasing income-earning assets, sacrificing present consumption for future consumption. Taxes can be levied on the principal (the original amount of money saved and invested), on the returns (the money generated from the investment), or on both.
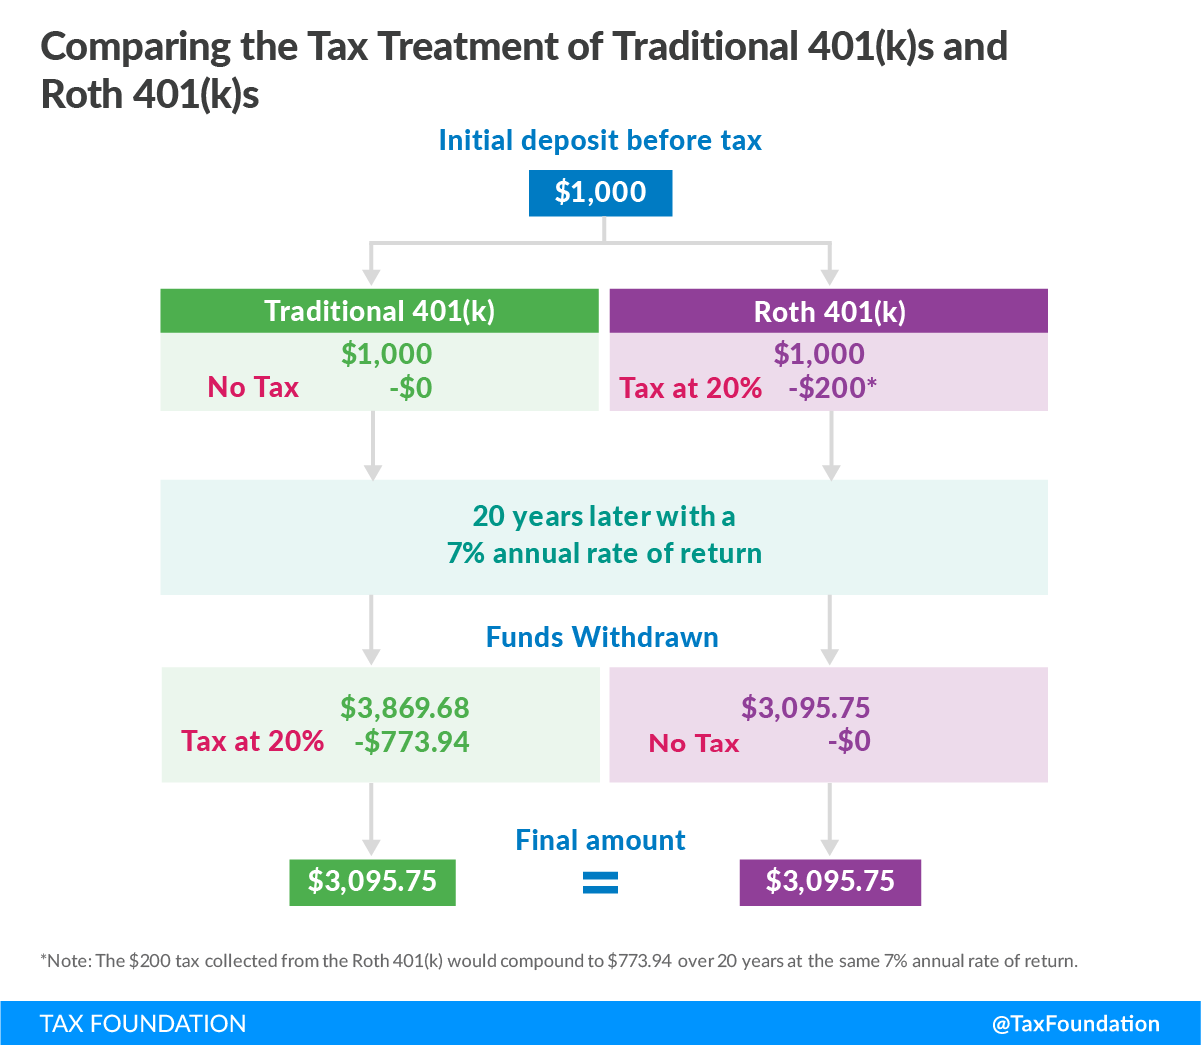
Under a saving/consumption-neutral tax system, each dollar, whether consumed immediately or saved for future consumption, is taxed only once. The timing of taxation on savings does not affect the neutrality of the tax code, and traditional- and Roth-style accounts therefore provide effectively identical tax treatment. In traditional, or tax-deferred, accounts, contributions are made with pretax dollars, but withdrawals are taxed. In Roth-style accounts, contributions are made with after-tax dollars, and distributions are tax-free. Assuming tax rates remain constant over an individual’s life, an individual pays the same amount of tax in either case.
For example, consider the two scenarios in Figure 1. An individual with $1,000, facing a hypothetical 20 percent tax rate, could deposit the full, pretax $1,000 in a traditional 401(k). After 20 years at an annual rate of return of 7 percent, the investment would grow to $3,869.68. The $3,869.68 would be taxed at the 20 percent rate at withdrawal, leaving the individual with $3,095.75.
Alternatively, with a Roth 401(k), the same person could pay taxes at the time of contribution, resulting in $800 saved in the account. After 20 years of investment at the same 7 percent annual rate of return, the account would grow to $3,095.75. The individual could withdraw the full $3,095.75, tax-free. Whether the tax is on the contribution or the withdrawal, the person’s savings and the tax revenue are the same.
Figure 1.

However, many forms of savings do not face the neutral, one-time taxation that traditional and Roth accounts face. Table 1 illustrates how the federal tax code applies to different forms of saving and investment: some are taxed on either the principal or the returns, some are taxed on both, and some are taxed on neither. The accounts in the lower-left and upper-right quadrants have the correct, neutral treatment of saving, with every dollar being taxed only once. Neutrality is violated when multiple levels of tax apply to the same dollar, as in the upper-left quadrant, and when no taxes apply, as in the bottom-right.[3]
Table 1. Four Tax Regimes for Saving and Investment
| |
Tax on Principal |
No Tax on Principal |
|
Tax on Returns
|
- Ordinary Savings Accounts
- Stocks
- Bonds
|
- Traditional IRAs and 401(k)s
- Defined Benefit Pensions
|
|
No Tax on Returns
|
- Roth IRAs
- Tax-exempt Bonds
- Owner-occupied Homes (below exempt gains thresholds)
- 529 Plans
|
- Labor Component of DIY Home Improvements
- Health Savings Accounts
- Employer-provided Health Insurance
|
In addition to personal income taxes on the principal and return, corporate income taxes on business profits and estate and gift taxes on financial and physical assets can cause saving to face up to four layers of taxation.[4] Each additional level further penalizes saving, lowers the relative tax burden for spending, and encourages consumption.
Complexity
A second flaw with Americans’ current savings options is their sheer complexity. There are 15 types of retirement accounts, each with an array of restrictions and requirements.[5] Many of these categories are further split into subcategories, each with its own rules, including employer and individual contribution limits, tax deduction limits, and guidelines for when savers can or must make withdrawals. Some plans are restricted to firms with a certain number of employees, while others are available generally; all plans have unique eligibility requirements based on factors such as age and time at a firm. In addition to these 15 retirement plans, the tax code provides options to promote saving for other specific ends—for example, 529 plans and Coverdell education savings accounts can only be used for education expenses.
By increasing the complexity of the tax code, the web of requirements and restrictions across these accounts complicates saving decisions, makes it difficult to understand the best way to save for any particular purpose, and creates a disincentive to take advantage of these plans. For example, in a recent survey asking why people don’t have an Individual Retirement Account (IRA), 28 percent of respondents said that they didn’t think they knew enough about IRAs, and 17 percent said they thought IRAs were too confusing. Only 54 percent said they actually understood the benefits of contributing to an IRA.[6] In another survey, 35 percent of people who do not save said they did not know what kind of account or product they would use if they did start saving.[7] Together, the multiple levels of taxation and complicated nature of existing savings options illustrate the need for a simple, neutral savings account.
A Short History of Universal Savings Accounts
A variety of USAs and similar programs have been proposed and implemented in recent years, in the U.S. and abroad. In the U.S., policymakers from both parties have proposed several variations of universal savings accounts, though none have been enacted. Presidents Clinton, Bush, and Obama all made USA-style proposals, albeit with different names.[8]
Senator Jeff Flake (R-AZ) and Representative Dave Brat (R-VA) introduced the Universal Savings Account Act in 2015[9] and 2017.[10] The legislation would have allowed anyone 18 or older to open a USA and contribute up to $5,500 a year, after tax, and to withdraw for any purpose, without taxes or penalties. More recently, the Family Savings Act of 2018 (H.R. 6757), part of the package of legislation dubbed “Tax Reform 2.0,” included a similar USA design, but with a maximum contribution of $2,500 in after-tax income.[11]
Other countries have implemented their own forms of USAs in recent years. Since 2009, Canada has had Tax-Free Savings Accounts (TFSAs), available to anyone 18 or older. The annual contribution limit in 2019 is $6,000 CAD (approximately $4,550 USD), but in past years has been as low as $5,000 CAD (approximately $3,790 USD) and as high as $10,000 CAD (approximately $7,580 USD).[12] Contributions are made with after-tax dollars, earnings grow tax-free, and withdrawals can be made for any reason. If someone makes less than the maximum contribution one year, the remaining contribution eligibility is added to the next year’s maximum contribution.[13]
The United Kingdom has had a similar program of Individual Savings Accounts (ISAs) since 1999. ISAs have an annual contribution limit of £20,000 (approximately $26,100 USD) and a minimum age requirement of either 16 or 18, depending on the type of ISA. As with TFSAs, contributions are made with after-tax dollars, and earnings grow tax-free; unlike with TFSAs, however, the rollover option is not allowed.[14]
Benefits of Universal Savings Accounts
USAs have several benefits over existing savings accounts: they are neutral, simple, and widely available.
Neutrality
USAs do not penalize withdrawals on account of their purpose or timing. In contrast, some types of existing savings accounts are not neutral, penalizing people who withdraw their money for anything but approved purposes at approved times. For example, withdrawals from 529 accounts can only be made without penalty if they are used to fund education. If a parent has a 529 account for a child but must make a withdrawal to cover emergency expenses, he or she must pay income taxes on the earnings, plus a 10 percent penalty.[15] Withdrawals from 401(k)s before the age of 59½ incur the same penalty, though there are certain exceptions.[16]
USAs’ neutrality would likely boost saving, for two reasons. First, when savings are not hit by multiple layers of taxation, savers can expect a higher return and are therefore likely to save more. Both IRAs and 401(k)s tax savings only once, and studies have estimated that roughly half of 401(k) balances, and roughly a quarter of all IRA contributions, constitute new saving—in other words, dollars that would have been spent are saved instead.[17] Similarly, in Canada, studies have found that if TFSA contributions do come from other accounts, they come from existing tax-disadvantaged savings, as people move their money from accounts that penalize saving to accounts that do not.[18]
Second, the availability of contributions for withdrawal could increase saving if people are currently deterred from saving out of fear of not having access to their contributions. USAs allow people to save for whatever purpose they see fit, without worrying about locking in money they may need in the future.
Simplicity
USAs’ lack of restrictions and regulations would also make them easier to understand. Because people could use USAs for any purpose, they would not have to master a set of complicated rules to use them. USAs would therefore have lower complexity costs than existing savings options and would avoid the current disincentive to save that these options create. Given that people’s confusion is an important factor in their decision not to save, ameliorating that confusion through USAs would likely boost savings. USAs would be a convenient option for people who are overwhelmed by the choices and rules of other savings accounts.
Availability
Finally, USAs would expand access to savings accounts for people who do not have retirement accounts through their employers or who are priced out of other options. For example, 35 percent of private-sector workers 22 or older do not work for employers offering 401(k)s.[19] USAs would be available to these people, as well as those who are self-employed, between jobs, or for some other reason lack access to an employer-sponsored retirement plan. They would also be more accessible because they do not require a minimum contribution. Those who are priced out of savings options with minimum contributions, such as some mutual funds, would still be able to save through a USA.
Responding to Objections
USAs Would Only Benefit High-Income Individuals
Some worry that USAs would primarily benefit high-income individuals and do little for anyone else. As income rises, savings generally increase both in total and as a percentage of income (in other words, the marginal propensity to save rises), so high-income people are more likely to maximize their USA contributions. In contrast, according to this argument, low-income individuals who are not already saving will not begin to do so with USAs. The problem is not the lack of an appropriate savings vehicle, but the lack of money to save in the first place.[20]
The evidence in Canada and the UK, however, suggests something different. Despite high-income individuals’ higher level of savings in TFSAs and ISAs, low-income individuals have saved more through TFSAs and ISAs as a percentage of income.[21]
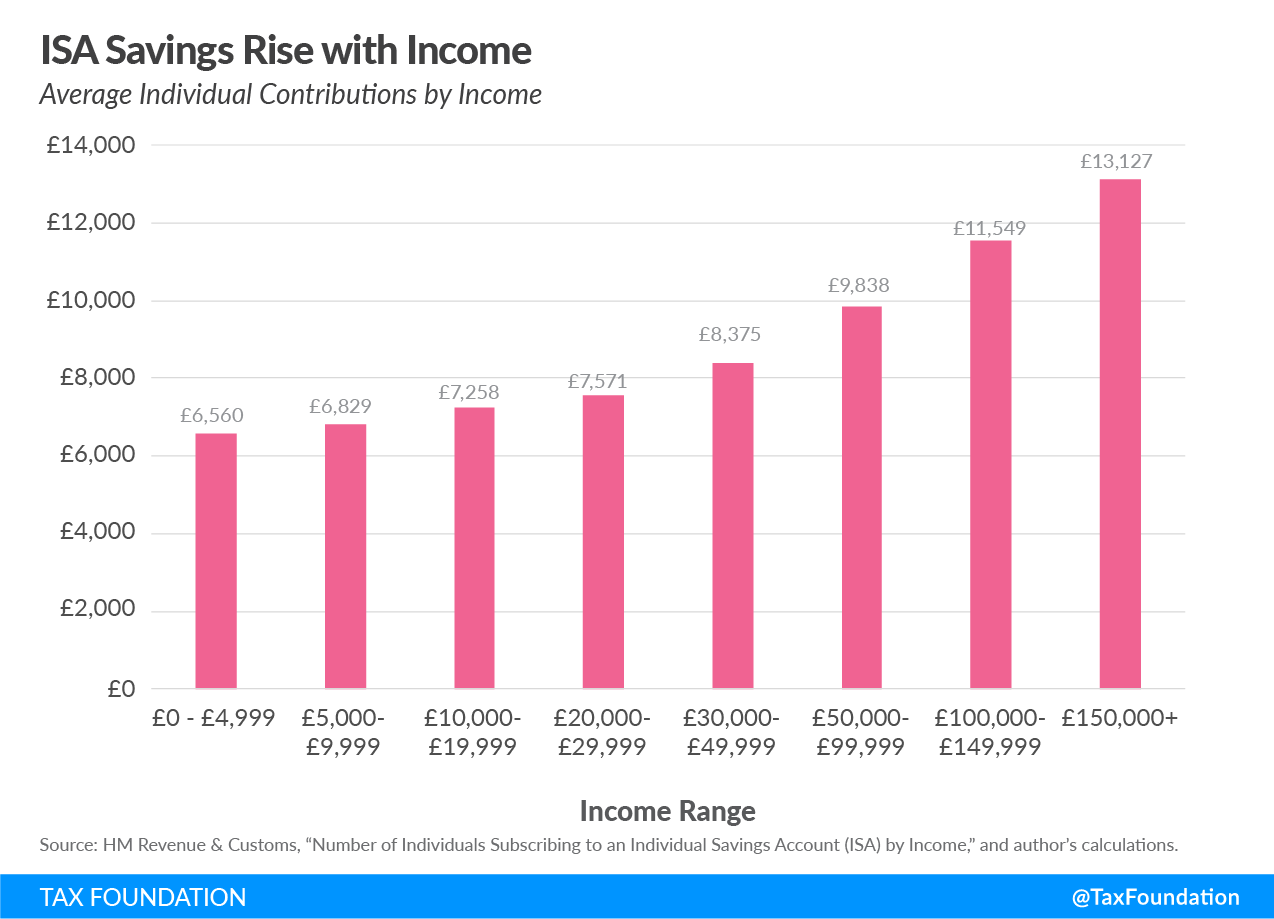
As Figures 2 and 3 show, average contributions to TFSAs and ISAs increase with income. For example, in Canada, the average TFSA contribution is $5,842 CAD for those making between $10,000 and $14,999, and $8,644 for those making between $100,000 and $149,999. Similarly, in the UK, the average ISA contribution is £6,829 for those making between £5,000 and £9,999, and £11,549 for those making between £100,000 and £149,999. This is as one might expect; higher-income individuals have more money to save, so they save more.
Figure 2.
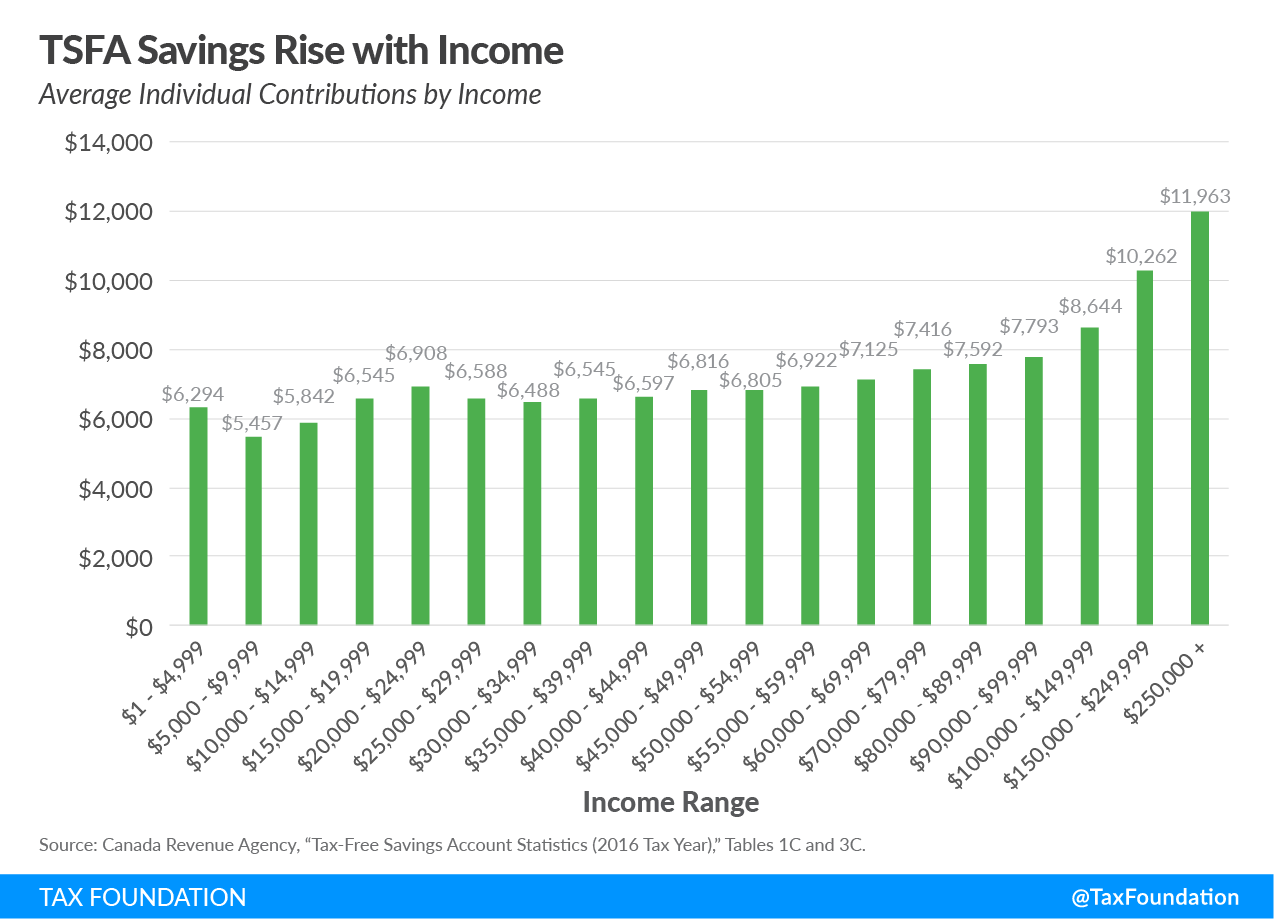
Figure 3.
However, as Figures 4 and 5 show, TFSA and ISA contributions as a percent of income fall as income rises.[22] For example, in Canada, the average TFSA contribution as a percent of income is 39 percent for those making between $10,000 and $14,999, and 5.8 percent for those making between $100,000 and $149,999. Similarly, in the UK, the average ISA contribution as a percent of income is 68.3 percent for those making between £5,000 and £9,999, and 7.7 percent for those making between £100,000 and £149,999.
Low-income individuals, despite their lower level of saving, nevertheless save more through USA equivalents as a percentage of income than do high-income individuals. USAs could therefore be a valuable savings vehicle for those who are typically least likely to save.
Furthermore, TFSA and ISA usage is widely distributed across income, rather than being concentrated only among high-income individuals. Figures 5 and 6 show the number of TFSA and ISA holders by income range.
Figure 4.
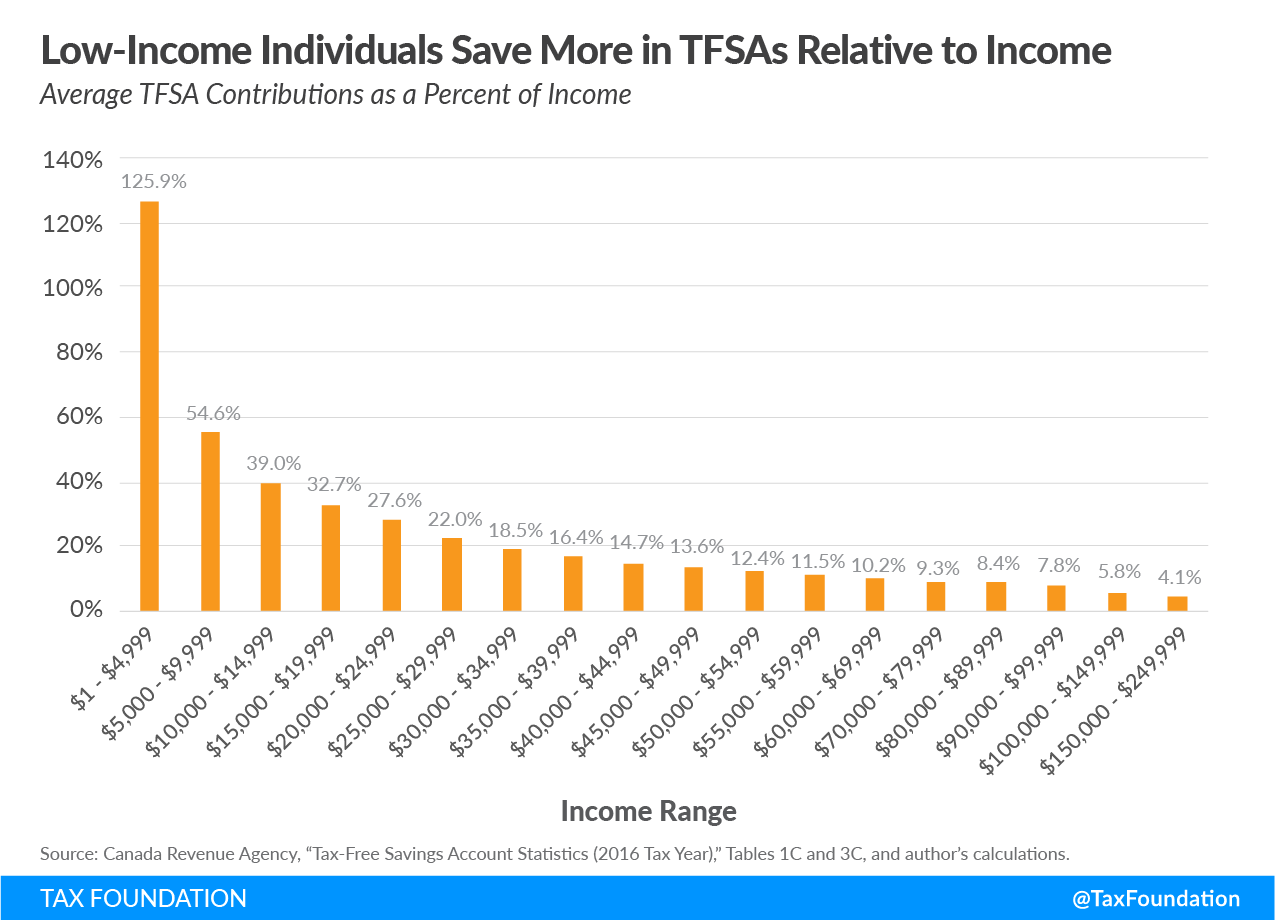
Figure 5.
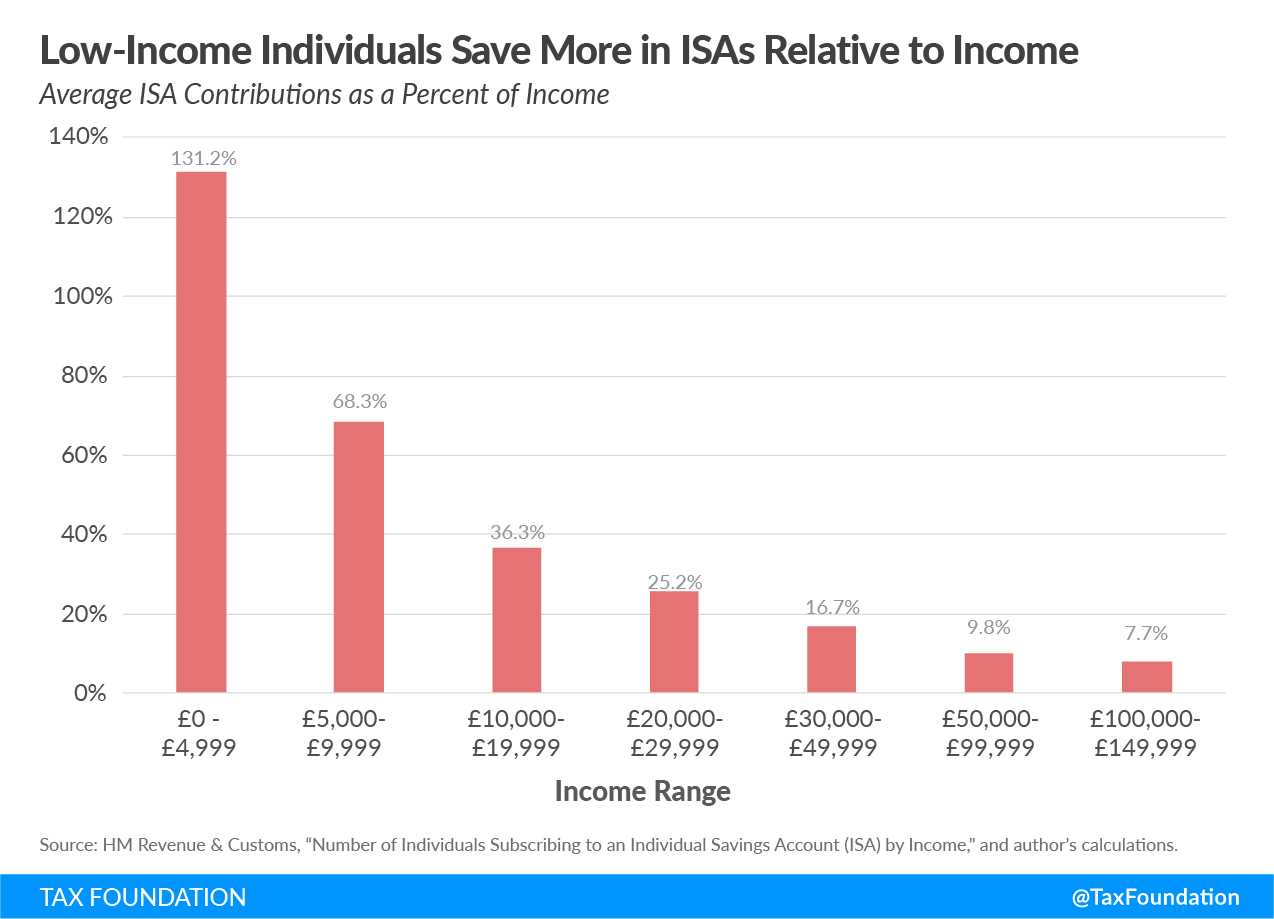
Figure 6.
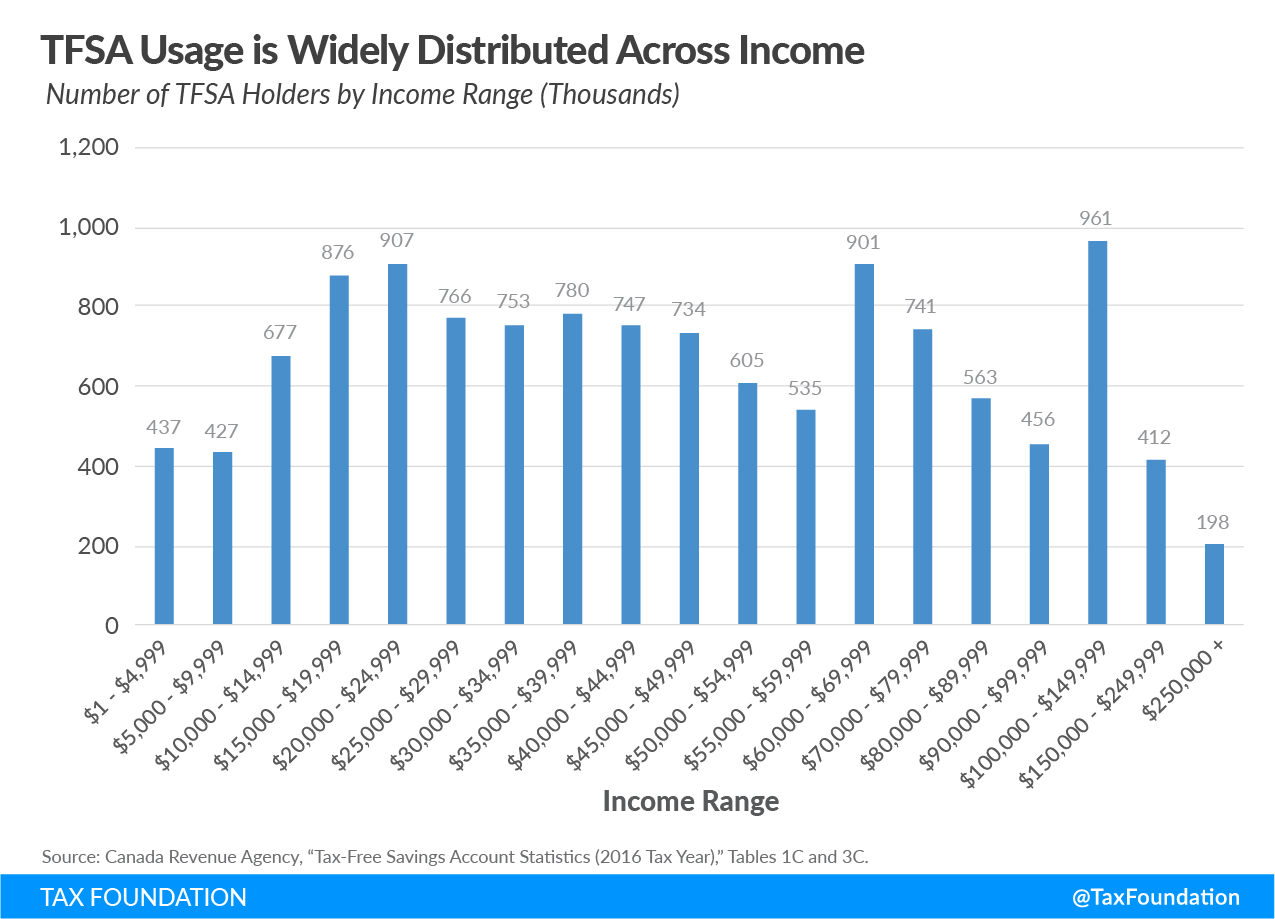
Figure 7.
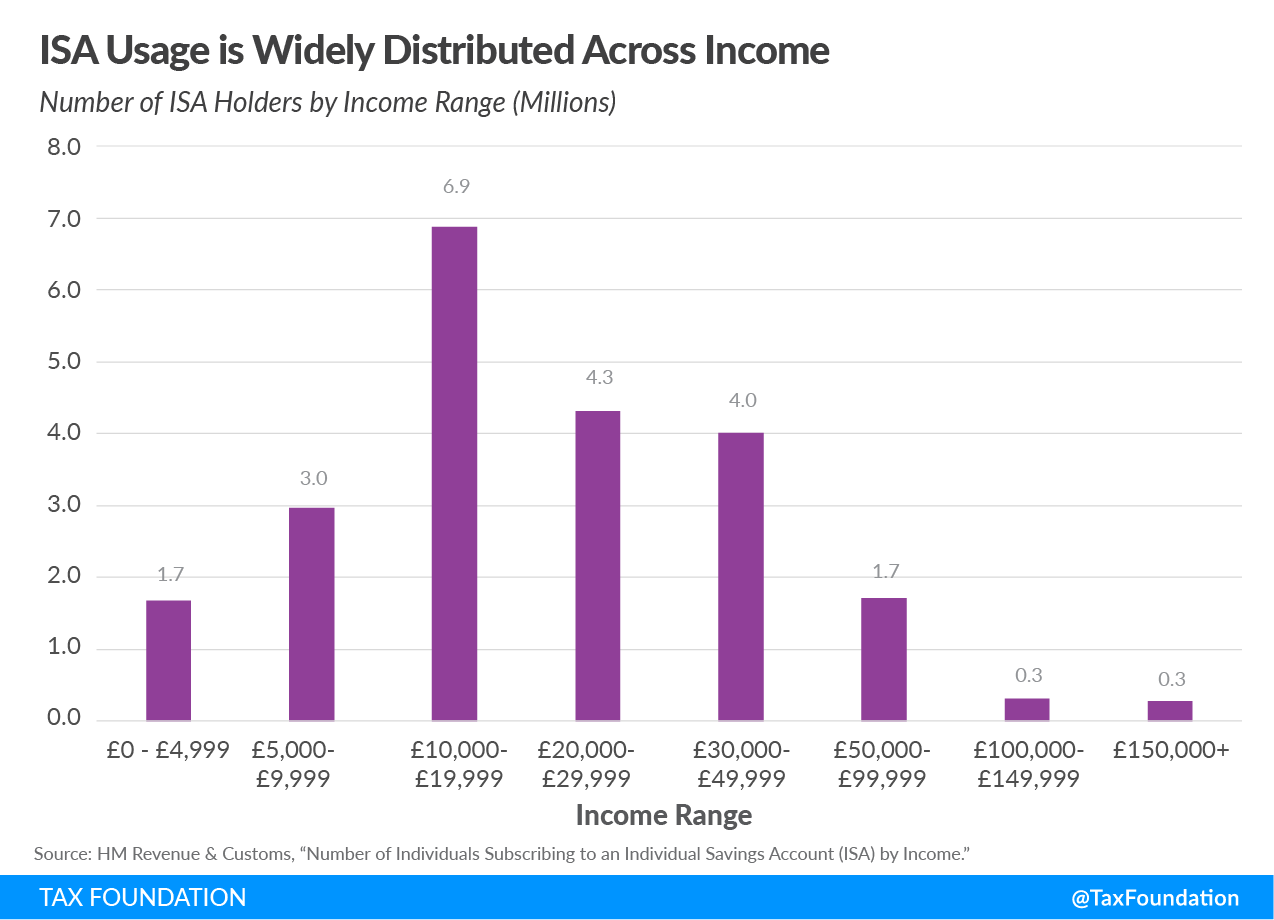
As these figures show, people from across the income spectrum have made use of TFSAs and ISAs. In fiscal year 2015-2016, when the median Canadian household income was $70,336 CAD (approximately $53,350 USD), 67.9 percent of TFSA holders had an income of less than $70,000 CAD (approximately $53,090 USD).[23] Similarly, in the same year, when the median after-tax income in the UK was £20,850 (approximately $27,210 USD), 52 percent of ISA holders had an income of less than £20,000 (approximately $26,100 USD).[24] Low- to middle-income individuals’ use of TFSAs and ISAs illustrates the widespread benefits of these accounts.
USAs Would Exacerbate Leakage
Another concern with any type of all-purpose savings account is “leakage.” Because USA funds can be withdrawn at any time, some worry that people with USAs might spend more of their savings over time than they would if early withdrawals were penalized.
Skeptics are correct when they note that leakage occurs in existing retirement savings accounts. One study concluded that leakage causes wealth in IRAs and 401(k)s to be at least 20 percent lower than it would be otherwise.[25] Another found that leakage could be responsible for as much as 40 cents of every dollar added to defined-contribution retirement savings accounts being drained for some other purpose.[26]
However, blocking leakage in USAs by limiting how and when savings can be used would only give USAs the same drawback as other accounts, as penalizing or preventing withdrawals would discourage people from contributing in the first place. A recent survey found that the most common reasons for not contributing more to TSFAs were that people simply did not have more money to invest and that they needed the money for other purposes.[27] Given the difficulty many people have saving, it is unlikely that they would save what they have if they knew they could not make necessary withdrawals.
Furthermore, USAs could decrease leakage in retirement accounts. If people had the choice between withdrawing from a retirement account with a penalty and withdrawing from a USA without one, they would have an incentive to choose the latter. People could withdraw from their USAs to cover short-term expenses, leaving their retirement savings alone to grow over time.[28] Leakage, and the difficulty many have saving, strengthen the case for an all-purpose, penalty-free account.
Considerations for Policymakers
There remain details for policymakers to consider when designing a USA, including setting an annual contribution limit, adjusting the limit over time, and choosing between traditional- or Roth-style tax treatment.
Annual Contribution Cap
Lawmakers would need to determine a limit for annual contributions.[29] Proposals in the U.S. and accounts in other countries have varied widely in their maximum contributions. For example, the Family Savings Act of 2018 proposed a maximum contribution of $2,500, while the Universal Savings Account Act proposed a maximum contribution of $5,500. Canada’s limit is approximately $4,550 USD, although for one year, the limit was approximately $7,580 USD.[30] The UK has a much higher cap of approximately $26,100 USD. Scholars have recently called for an American USA with a maximum contribution of $10,000.[31]
Policymakers could also consider allowing rollovers. For example, with a limit of $10,000, someone who contributed $5,000 in 2019 could contribute $15,000 in 2020. Such a policy would allow people to save more in some years to make up for less in other years and would help those who wish they had started saving earlier in life. Canadian TFSAs allow rollovers, while British ISAs do not.
Adjusting Limits Over Time
In addition to setting an original contribution limit, policymakers would have to consider whether to raise the limit over time or to set it at a constant level. If the maximum contribution is set at a certain amount and does not increase over time, inflation will gradually reduce USAs’ saving potential. Inflation without indexing often has unintended consequences, such as “bracket creep,” when people are pushed into higher income tax brackets without an increase in real income.
Options include annually increasing the maximum contribution amount by a set amount, indexing the limit to inflation, or even raising the limit by a multiple of the inflation rate. Under the third method, USAs could gradually grow in importance relative to other savings options.[32] TFSA limits are indexed to inflation and rounded to the nearest $500.[33] ISA limits have been indexed to inflation in the past but are currently set at a fixed amount.[34]
Traditional or Roth
A third issue for lawmakers to consider is whether to apply traditional- or Roth-style tax treatment to USAs. As noted earlier, from the individual taxpayer’s perspective, there is no meaningful difference in taxes or savings between the two, assuming one remains in the same tax bracket before and after retirement. From a government finance perspective, however, the issue is more complicated.
Lawmakers thinking in terms of a ten-year budget window might find Roth-style treatment more desirable, as it would quickly generate revenue through the taxation of contributions. However, traditional-style plans would allow the government to generate more revenue than a Roth-style treatment in the long run. The government has a lower discount rate than private investors, so by allowing the assets in USAs to mature in the private market before taxing them, the government would earn more revenue in real terms than it would under Roth-style tax treatment.
Additionally, traditional-style treatment creates the opportunity to generate government revenue from unusually high, “supernormal” returns. Because supernormal returns cannot be predicted, having the government share in these gains does not distort incentives.[35]
Conclusion
Universal savings accounts are the savings option Americans need. Where other programs allow saving to receive proper tax treatment only for specific reasons, USAs would help Americans save without penalties, no matter what their needs are. Where other programs come with a set of inscrutable rules and regulations, USAs are simple and easy to understand. Where other programs distort incentives and discourage saving through multiple levels of taxation, USAs are neutral. They are not anything like a silver bullet for the problems facing America’s saving and investment, but they could nevertheless help Americans save what is necessary to respond to unpredictable shortcomings and drive a growing economy.
Notes
[1] Alan Cole, “Losing the Future: The Decline of U.S. Saving and Investment,” Tax Foundation, Oct. 1, 2014,
https://taxfoundation.org/losing-future-decline-us-saving-and-investment.
[2] Federal Reserve Board, Report on the Economic Well-Being of U.S. Households in 2017, May 2018, 2, https://www.federalreserve.gov/publications/files/2017-report-economic-well-being-us-households-201805.pdf.
[3] The absence of any taxation on investments can have unintended consequences. For example, the tax-free status of employer-provided health insurance policies contributes to the overconsumption of health care and raises its price. It also ties to their jobs workers who wish to retain health insurance or puts them at risk of loss of coverage or an increase in premiums for preexisting conditions if they change employment. See Michael Schuyler and Stephen J. Entin, “Case Study #6: The Exclusion for Employer Provided Health Insurance,” Tax Foundation, Aug. 5, 2013, https://taxfoundation.org/case-study-6-exclusion-employer-provided-health-insurance/.
[4] Andrew Lundeen, “Let’s Eliminate the Tax Code’s Bias Against Saving with Universal Savings Accounts,” Tax Foundation, May 11, 2015. https://taxfoundation.org/let-s-eliminate-tax-codes-bias-against-saving-universal-savings-accounts/.
[5] Internal Revenue Service, “Types of Retirement Plans,” https://www.irs.gov/retirement-plans/plan-sponsor/types-of-retirement-plans.
[6] TIAA, 2017 TIAA IRA Survey: Executive Summary, March 14, 2017, 3-4, https://www.tiaa.org/public/pdf/ira_survey_executive_summary.pdf.
[7] Discover, “Discover Study Finds Millennials Are Saving More Than Other Generations,” Jan. 10, 2018, https://investorrelations.discover.com/newsroom/press-releases/press-release-details/2018/Discover-Study-Finds-Millennials-Are-Saving-More-Than-Other-Generations/default.aspx?print=1.
[8] Bill Clinton, “Remarks of the President on Universal Savings Accounts,” White House Office of the Press Secretary, April 14, 1999, https://clintonwhitehouse4.archives.gov/WH/New/html/19990414-3020.html;
Joseph B. Treaster and Mary Williams Walsh, “Bush to Propose Expansion Of I.R.A.-Like Investments,” The New York Times, Jan. 31, 2003, https://www.nytimes.com/2003/01/31/business/bush-to-propose-expansion-of-ira-like-investments.html; Barack Obama, “Remarks of President Barack Obama – Address to Joint Session of Congress,” White House Office of the Press Secretary, Feb. 24, 2009, https://obamawhitehouse.archives.gov/the-press-office/remarks-president-barack-obama-address-joint-session-congress.
[9] H.R. 4094, S. 2320.
[10] H.R. 937, S. 232.
[11] Family Savings Act of 2018, H.R. 6757, 115th Congress, 2nd Sess.
[12] Government of Canada, “Contributions,” Jan. 25, 2019, https://www.canada.ca/en/revenue-agency/services/tax/individuals/topics/tax-free-savings-account/contributions.html.
[13] Government of Canada, “Tax-Free Savings Account (TFSA), Guide for Individuals,” Feb. 11, 2019, https://www.canada.ca/en/revenue-agency/services/forms-publications/publications/rc4466/tax-free-savings-account-tfsa-guide-individuals.html.
[14] HM Revenue & Customs, “Individual Savings Account (ISA) Statistics,” August 2018, https://assets.publishing.service.gov.uk/government/uploads/system/uploads/attachment_data/file/737394/Full_Statistics_Release_August_2018.pdf.
[15] Internal Revenue Service, “Tax Benefits for Education,” Jan. 31, 2018, 53, https://www.irs.gov/pub/irs-pdf/p970.pdf.
[16] Internal Revenue Service, “401(k) Resource Guide – Plan Participants – General Distribution Rules,” May 29, 2018, https://www.irs.gov/retirement-plans/plan-participant-employee/401k-resource-guide-plan-participants-general-distribution-rules.
[17] Daniel J. Benjamin, “Does 401(k) Eligibility Increase Saving? Evidence from Propensity Score Subclassification,” Journal of Public Economics 87 (2003), https://pdfs.semanticscholar.org/bb24/812845012f56b908170f6634dc679d8a0f6c.pdf; R. Glenn Hubbard and Jonathan S. Skinner, “Assessing the Effectiveness of Saving Incentives,” Journal of Economic Perspectives Vol, 10, no. 4 (Fall 1996), https://www.albany.edu/~mj770/530/HS-saving.pdf.
[18] Adam M. Lavecchia, “Tax-Free Savings Accounts: Who Uses Them and How?” University of Ottawa Working Paper (1802E), January 2018, https://pdfs.semanticscholar.org/14cf/ae18f13215d1f010fdca8b2736de945381fd.pdf?_ga=2.148039733.320791662.1540238802-401782580.1540238802.
[19] The Pew Charitable Trusts, “Retirement Plan Access and Participation Across Generations,” Feb. 15, 2017, https://www.pewtrusts.org/en/research-and-analysis/issue-briefs/2017/02/retirement-plan-access-and-participation-across-generations.
[20] For example, David Mitchell, Associate Director at the Aspen Institute Financial Security Program, has said, “People don’t lack emergency savings because the investment returns on those savings are taxed. They lack them because, first and foremost, they’re living paycheck to paycheck and their budgets are stretched thin.” See Amanda Dixon, “We’re Closer to Getting Universal Savings Accounts, But They May Not Boost the Low Savings Rate,” Bankrate, Oct. 30, 2018, https://www.bankrate.com/banking/savings/universal-savings-accounts/.
[21] HM Revenue & Customs, “Number of Individuals Subscribing to an Individual Savings Account (ISA) by Income,” April 27, 2018, https://www.gov.uk/government/statistics/number-of-individuals-subscribing-to-an-individual-savings-account-isa-by-income; Canada Revenue Agency, “Tax-Free Savings Account Statistics (2016 Tax Year),” Tables 1C and 3C, https://www.canada.ca/en/revenue-agency/programs/about-canada-revenue-agency-cra/income-statistics-gst-hst-statistics/tax-free-savings-account-statistics/tax-free-savings-account-statistics-2016-tax-year.html.
[22] Calculations use the maximum income in each income range, but using minimum income provides similar results. A potential reason for contributions to exceed 100 percent of income for people in the lowest income range in both countries is that people whose wealth lies in liquid assets contributed to their accounts but had low income as a result of, for example, tax loss.
[23] Canada Revenue Agency, “Tax-Free Savings Account Statistics (2016 Tax Year),” Table 1C; Statistics Canada, “Household Income in Canada: Key Results from the 2016 Census,” Sept. 13, 2017, 1, https://www150.statcan.gc.ca/n1/en/daily-quotidien/170913/dq170913a-eng.pdf?st=7mSiAhqM.
[24] HM Revenue & Customs, “Distribution of Median and Mean Income and Tax By Age Range and Gender,” March 6, 2018, https://www.gov.uk/government/statistics/distribution-of-median-and-mean-income-and-tax-by-age-range-and-gender-2010-to-2011; HM Revenue & Customs, “Number of Individuals Subscribing to an Individual Savings Account (ISA) by Income.”
[25]Alicia H. Munnell and Anthony Webb, “The Impact of Leakages from 401(k)s and IRAs,” Center for Retirement
Research at Boston College, Working Paper (2015-2), February 2015, http://crr.bc.edu/wp-content/uploads/2015/02/wp_2015-2.pdf.
[26] John Beshears et al., “Liquidity in Retirement Savings Systems: An International Comparison,” American Economic Review 105, no. 5 (May 2015), https://www.ncbi.nlm.nih.gov/pmc/articles/PMC4504682/.
[27] Bank of Montreal, “BMO Annual TFSA Report: Canadians’ Knowledge and Annual Contributions to Tax-Free Savings Accounts on the Rise,” Feb. 28, 2018, https://newsroom.bmo.com/2018-02-28-BMO-Annual-TFSA-Report-Canadians-Knowledge-and-Annual-Contributions-to-Tax-Free-Savings-Accounts-On-The-Rise.
[28] Proponents of TFSAs have similarly noted the accounts’ potential to counteract leakage in retirement accounts. For example, Benjamin Tal has written, “This liquidity feature of the TFSA plan is of great importance as it will probably work to limit or even eliminate uneconomical behaviour such as RRSP [Registered Retirement Savings Account] withdrawal. In fact, the liquidity feature is viewed by Canadians to be as important as the tax-free feature in the decision to open a TFSA.” See Benjamin Tal, “The New Tax-Free Savings Account: How Popular Will It Be?” Canadian Imperial Bank of Commerce, Sept. 11, 2008, 2-3, http://research.cibcwm.com/economic_public/download/cwcda-080911.pdf.
[29] In theory, USAs could forgo a contribution cap and allow unlimited contributions. However, all existing and proposed USAs have had a limit.
[30] Canada Revenue Agency, “Tax-Free Savings Account (TFSA), Guide for Individuals.”
[31] Adam N. Michel, “Universal Savings Accounts Can Help All Americans Build Savings,” The Heritage Foundation, Dec. 4, 2018, https://www.heritage.org/sites/default/files/2018-12/BG3370_0.pdf; Ryan Bourne and Chris Edwards, “Tax Reform and Savings: Lessons from Canada and the United Kingdom,” Cato Institute, May 1, 2017, https://object.cato.org/sites/cato.org/files/pubs/pdf/tbb-77-update-2.pdf.
[32] Adam N. Michel, “Universal Savings Accounts Can Help All Americans Build Savings.”
[33] Government of Canada, “Contributions.”
[34] HM Revenue & Customs, “Individual Savings Account (ISA) Statistics.”
[35] Amir El-Sibaie, “What Rothification Means for Tax Reform,” Tax Foundation, Sept. 12, 2017. https://taxfoundation.org/what-rothification-means-for-tax-reform/.
![]()
Source: Tax Policy – The Case for Universal Savings Accounts


 TAXTIMEKC