
by r Hampton | Jan 31, 2019 | Tax News
Tax Policy – Sanders’ Estate Tax Plan Won’t Likely Raise the Revenue Intended
Today, Senator Bernie Sanders (I-VT) introduced a plan to make the estate tax more progressive, in hopes that this wealth transfer tax will raise as much as $315 billion over ten years, and as much as $2.2 trillion over the lifetime of the policy. Sanders’ top marginal rate would return the estate tax to its historic high of 77 percent—the top rate that existed from 1942 to 1976.
But despite the progressivity, there is good reason to believe Sanders’ plan won’t raise revenue as intended.
Currently, the estate tax levies a 40 percent tax on the total value of property passed to heirs beyond a roughly $11 million exemption for individuals ($22 million for married couples). Sen. Sanders’ plan would:
- Reduce the exemption to $3.5 million, and tax the value of estates up to $10 million at a rate of 45 percent
- Tax estates valued between $10 million and $50 million at a rate of 50 percent
- Tax estates valued between $50 million and $1 billion at 55 percent
- Tax estates valued at more than $1 billion at a rate of 77 percent.
This progressivity could hamper revenue collections for a few reasons.
For one, this tax on the wealthiest would target (0.2 percent of the country, according to Sen. Sanders) with relatively high marginal tax rates that increase with an estate’s value. Because of the high rates and the progressive rate structure, high-net-worth individuals will have a strong incentive to shelter their assets to avoid the tax.
In general, tax avoidance is costly both from an economic standpoint (because it encourages unproductive tax planning) and a revenue standpoint, as people hide their money from tax collectors. But the estate tax generates particularly large compliance costs. In fact, research has shown that the compliance costs associated with estate planning are actually greater than the revenue the estate tax generates.
And perhaps most importantly, Sen. Sanders’ plan is problematic because it would increase the estate tax’s burden on investment, a key driver of economic growth. To the extent that Sanders’ plan encourages people to consume their income instead of invest it, it will reduce economic output, and with it, government revenues on a dynamic basis. This is because reductions in the size of the economy reduce the output available to government to tax.
While progressivity may look appealing—particularly at a time when policymakers in Congress seem to be competing on how best to extract revenue from the wealthiest in the country—it may not raise the revenue intended.
![]()
Source: Tax Policy – Sanders’ Estate Tax Plan Won’t Likely Raise the Revenue Intended

by r Hampton | Jan 31, 2019 | Tax News
Tax Policy – Income Taxes on the Top 0.1 Percent Weren’t Much Higher in the 1950s
Lawmakers have recently announced plans that would increase the tax burden on wealthy Americans, ranging from higher marginal income tax rates to wealth taxes. These proposals are flawed in several ways, including in their lack of understanding of tax history.
While marginal income tax rates have come down from their highs of 91 and 92 percent in the 1950s, changes in the tax base—how much and what types of income are subject to the tax—mean the effective rates on the wealthy haven’t changed nearly as much.
The graph below illustrates the average tax rates that the top 0.1 percent of Americans faced over the last century, based on research from Thomas Piketty, Emmanuel Saez, and Gabriel Zucman.[1] The blue line includes the impact of all federal, state, and local taxes on individual income, payroll taxes, estates, corporate profits, properties, and sales. The purple line shows income taxes only, including federal, state, and local.
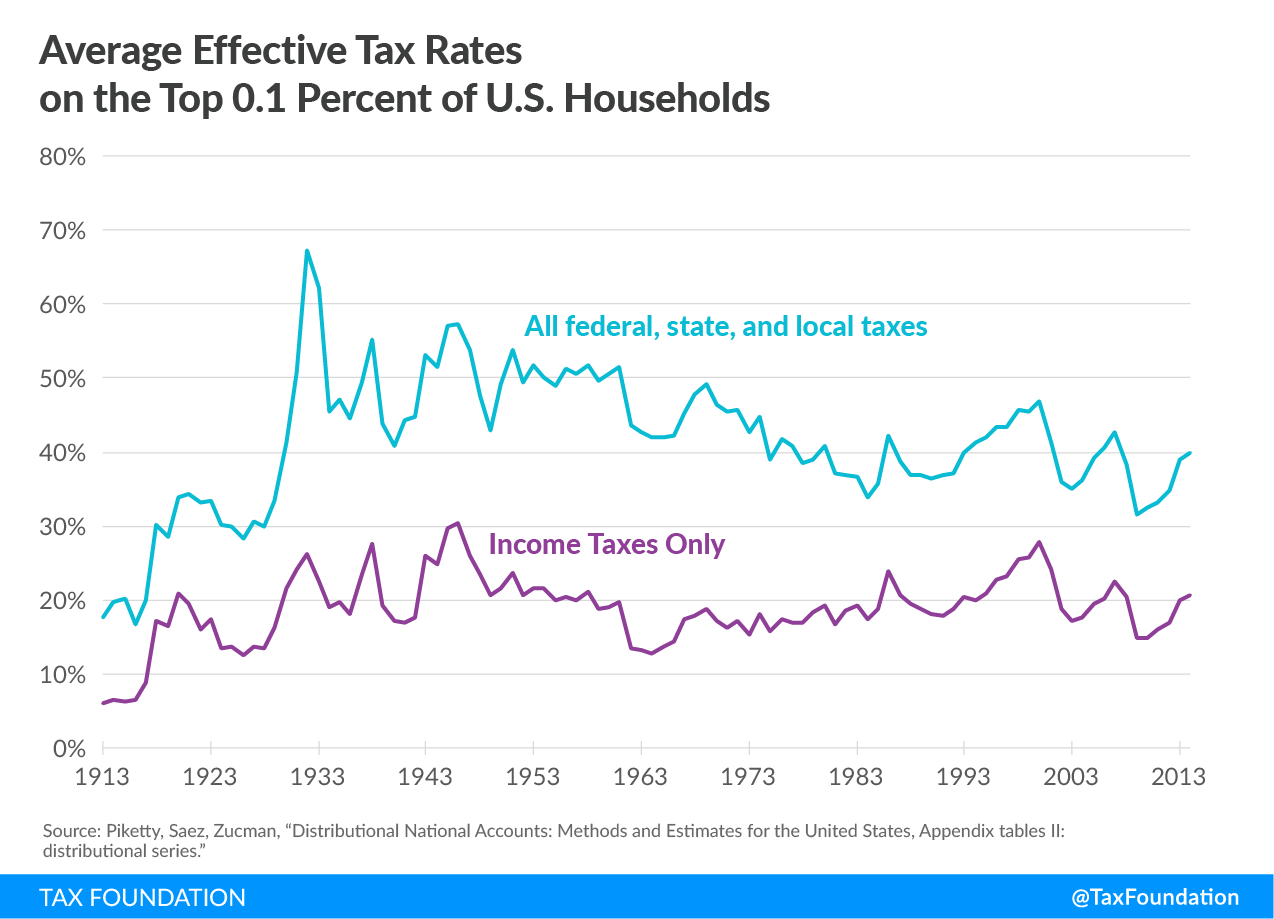
While the average rates for total taxes on the top 0.1 percent have fallen 10.8 percentage points from the 1950s, average income tax rates have remained relatively stable. In the 1950s, the top 0.1 percent of households paid average income tax rates of 21.0 percent, versus 20.7 percent as of 2014.
How could it be that a top marginal income tax rate of 91 percent resulted in an average income tax rate (including state and local income taxes!) of only 21.0 percent for the top 0.1 percent during the 1950s? A previous Tax Foundation analysis explains:
- The 91 percent bracket of 1950 only applied to households with income over $200,000 (or about $2 million in today’s dollars). Only a small number of taxpayers would have had enough income to fall into the top bracket—fewer than 10,000 households, according to an article in The Wall Street Journal.
- Even among households that did fall into the 91 percent bracket, the majority of their income was not necessarily subject to that top bracket. After all, the 91 percent bracket only applied to income above $200,000, not to every single dollar earned by households.
- Finally, it is very likely that the existence of a 91 percent bracket led to significant tax avoidance and lower reported income. Many studies show that, as marginal tax rates rise, income reported by taxpayers goes down. As a result, the existence of the 91 percent bracket did not necessarily lead to significantly higher revenue collections from the wealthy.
Another factor to consider is that the wealthy aren’t a monolithic group of taxpayers. In fact, IRS data shows that there is typically a lot of churn within the group of top earners. For example, the number of taxpayers who report incomes of $1 million or more is highly variable, and fluctuates with the business cycle.
Ultimately, tax rates, while important, are only one part of the story. The top 0.1 percent of taxpayers pay nearly the same average tax rates today as they did in the 1950s because of other changes made to the tax system. And even with these changes, the American tax system is already highly progressive: according to the most recent IRS data, the top 0.1 percent of taxpayers paid more than six times the share of federal income taxes than the bottom 50 percent of taxpayers combined.
Context like this is crucial for discussions of how much the wealthy pay in taxes today, and how much they’ve paid over time. By historical standards, the very top income earners do not face an unusually low income tax burden.
[1] Some of the distributional assumptions in the Piketty, Saez, and Zucman paper are questionable. In particular, the authors assume that the full burden of the corporate income tax falls on owners of capital, which may not be correct. It is likely that the corporate income tax burden falls on shareholders, workers, and consumers. See Stephen J. Entin, “Labor Bears Much of the Cost of the Corporate Tax,” Tax Foundation, Oct. 24, 2017, https://taxfoundation.org/labor-bears-corporate-tax/.
![]()
Source: Tax Policy – Income Taxes on the Top 0.1 Percent Weren’t Much Higher in the 1950s
by r Hampton | Jan 31, 2019 | Tax News
Tax Policy – Implementing Phase Three of Individual Income Tax Cuts in Arkansas
Yesterday, Governor Hutchinson and legislative leaders in Arkansas announced their final plan for restructuring Arkansas’s individual income tax brackets. After more than 18 months of study, the Arkansas General Assembly will consider the plan starting next week. The plan would lower tax liabilities for a number of filers in Arkansas and implements the third phase of tax cuts in the Natural State.
The plan introduced today differs from previous versions discussed in the Tax Reform and Relief Legislative Task Force. Several weeks ago, it was reported that the previous version of the “2/4/5.9% plan,” as it was known, contained a miscalculation, which would have increased taxes for approximately 200,000 Arkansans.
This new plan targets the tax relief onto higher-income Arkansans, defined as those with taxable incomes above $79,300. Arkansas currently uses three rate schedules for individuals, based on their income. This plan would simplify the third rate schedule, reducing state revenues by $97 million over the next several years.
Starting on January 1, 2020, the plan would simplify the brackets for those above $79,300 in income from six to three, with the top rate falling from 6.9 percent to 6.6 percent. Then, on January 1, 2021, the top rate would be cut again from 6.6 percent to 5.9 percent. At the same time, the top rate on the middle rate schedule, for those between $22,200 and $79,300 in income, would drop from 6 percent to 5.9 percent, to match the top table.
Individual Income Tax Rates (2019)
| Total Income Under $22,000 |
|
Total Income Between $22,200 and $79,300 |
|
Total Income Above $79,300 |
| $0-$4,499 |
0% |
|
$0-$4,499 |
0.75% |
|
$0-$4,499 |
0.90% |
| $4,500-$8,899 |
2% |
$4,500-$8,899 |
2.50% |
$4,500-$8,899 |
2.50% |
| $8,900-$13,399 |
3% |
$8,900-$13,399 |
3.50% |
$8,900-$13,399 |
3.50% |
| $13,400-$22,199 |
3.40% |
$13,400-$22,199 |
4.50% |
$13,400-$22,199 |
4.50% |
| |
$22,200-$37,199 |
5% |
$22,200-$37,199 |
6.00% |
| $37,200-$79,300 |
6% |
$37,200+ |
6.90% |
|
Note: the exact brackets will change slightly due to Arkansas’s policy of inflation-adjusting its brackets annually.
|
| Total Income Under $22,200 |
|
Total Income Between $22,201 and $79,300 |
|
Total Income Above $79,300 |
Individual Income Tax Rates (2021, Proposed)
| $0-$4,499 |
0% |
|
$0-$4,499 |
0.75% |
|
$0-$4,000 |
2.00% |
| $4,500-$8,899 |
2% |
$4,500-$8,899 |
2.50% |
$4,000-$8,000 |
4.00% |
| $8,900-$13,399 |
3% |
$8,900-$13,399 |
3.50% |
$8,000+ |
5.90% |
| $13,400-$22,199 |
3.40% |
$13,400-$22,199 |
4.50% |
|
| |
$22,200-$37,199 |
5% |
| $37,200-$79,300 |
6% |

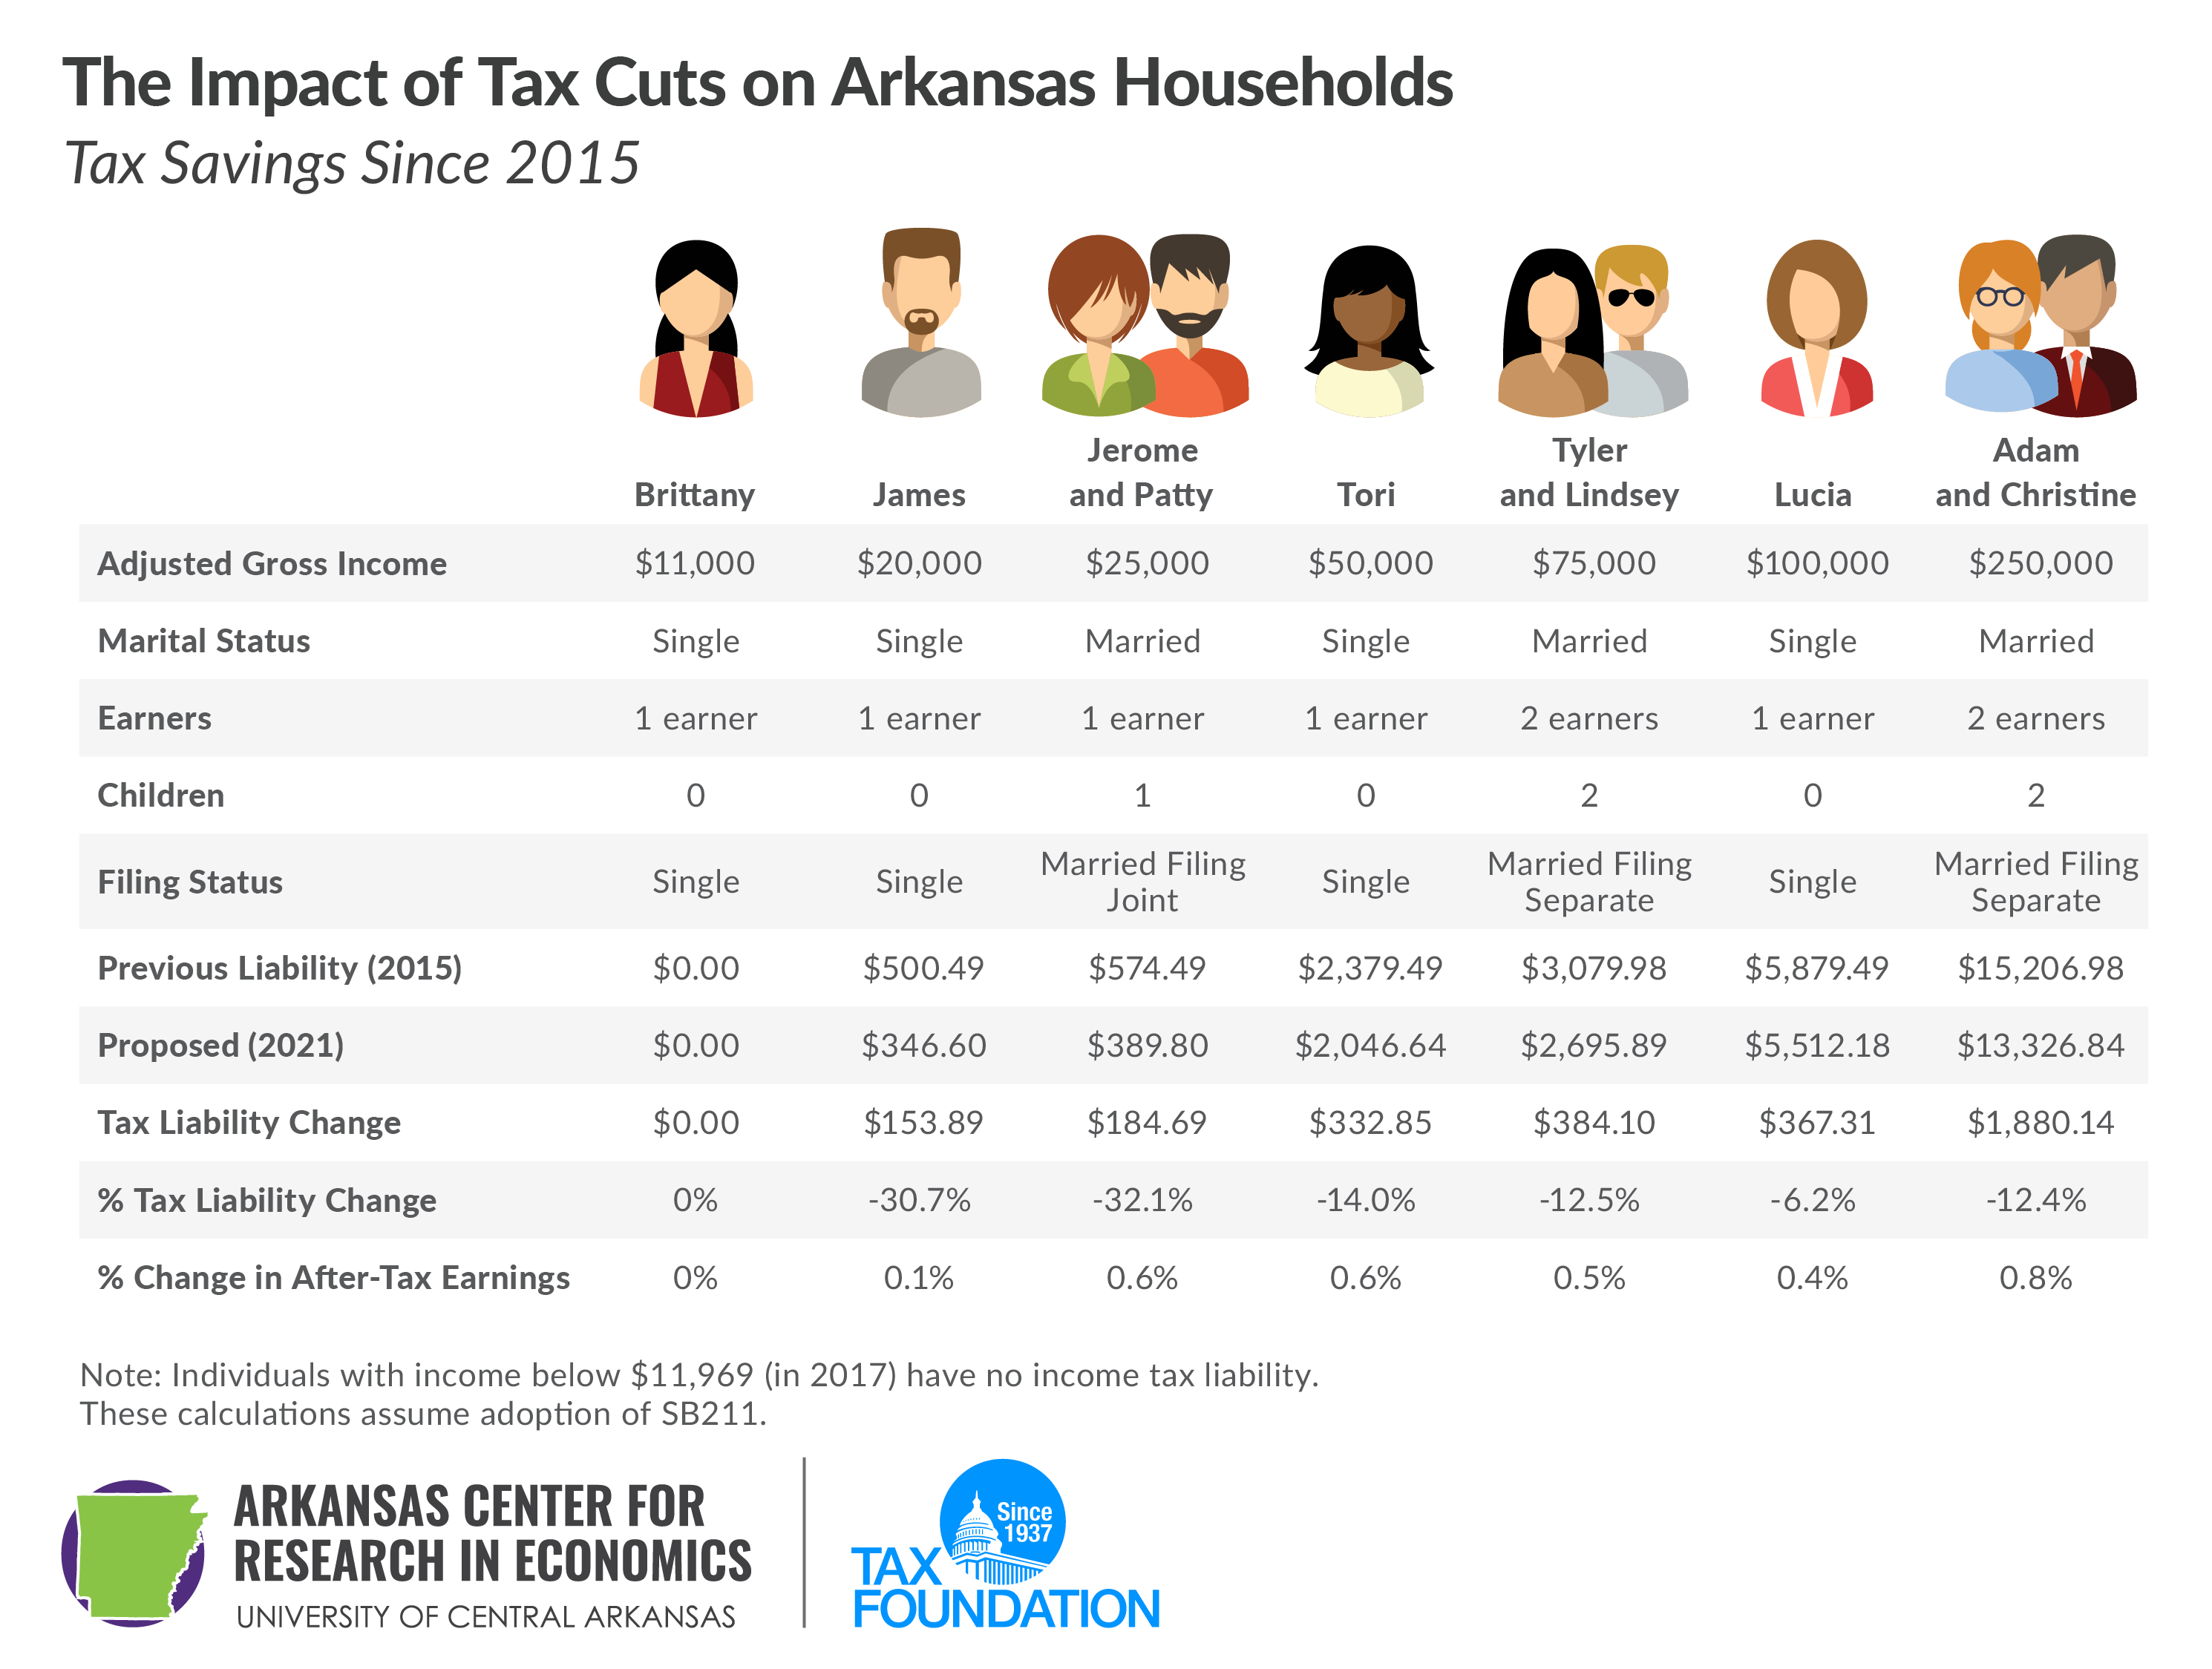
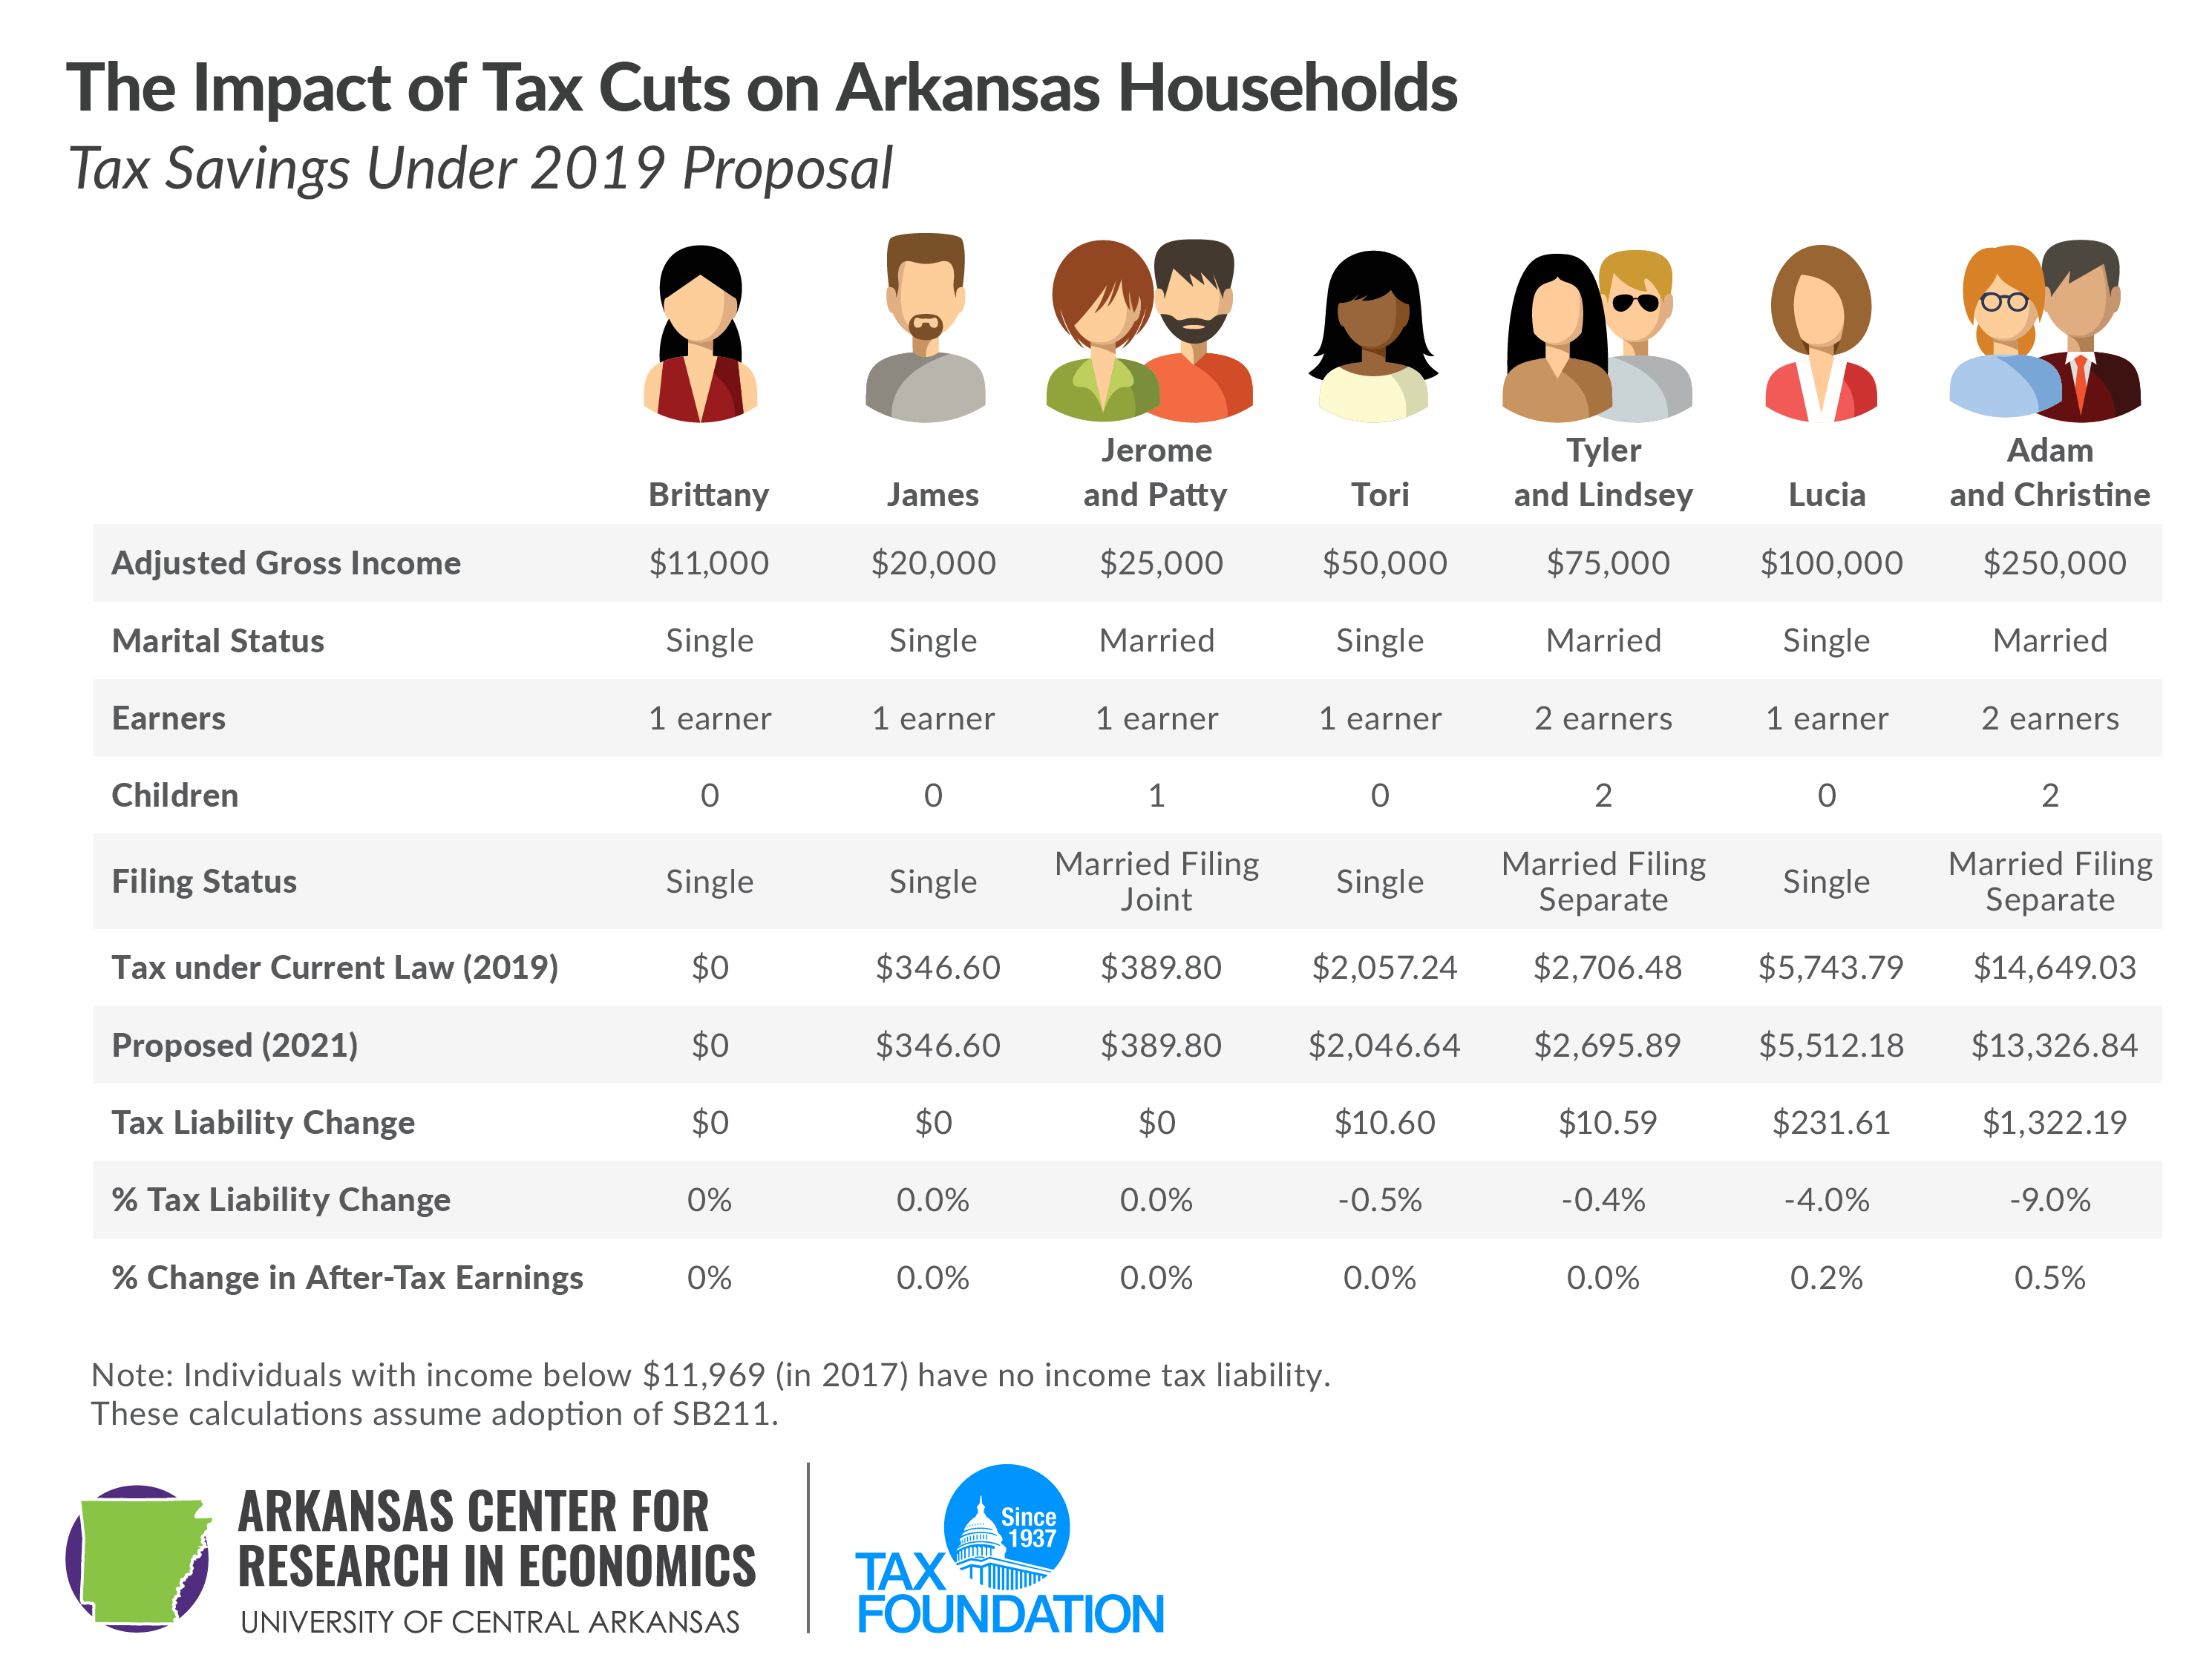
We have estimated the impact of these tax cuts on seven sample taxpayers in Arkansas. As shown below, taxes would be lowered for those with income above $37,200. Those below that income level do not see any tax cuts under this plan.
However, these cuts are the third phase of the individual income tax cuts in Arkansas. Looking only at the 2019 proposal misses much of the work done by the General Assembly in previous sessions. First, in 2015, it passed tax cuts for individuals with incomes between $21,000 and $75,000. Second, in 2017, it passed tax cuts for individuals with incomes below $21,000. (Single individuals with income below $11,969 have no income tax liability due to Arkansas’s low-income tax credit first adopted in 1991 and expanded in 2007.) So, this final plan brings those with incomes above $75,000 closer to the cuts already passed in 2015 and 2017. (These numbers vary slightly due to Arkansas’s policy of inflation-adjusting their tax brackets annually.)
Here, we see that the income tax cuts are spread throughout the income spectrum. James has seen his income tax cut by 30.7 percent since 2015, compared to a 14 percent reduction for Tori and a 6.2 percent reduction for Lucia. Adam and Christine receive the largest nominal tax cut, $1,880.14, but as a percent of their income, their cut is among the smallest.
The $97 million revenue cost is also similar to that of the 2015 tax cut targeted at middle-income taxpayers.
And the reduction of the top rate from 6.9 percent to 5.9 percent makes Arkansas more competitive among its neighbors and in the South generally. Currently, the 6.9 percent rate is the highest among Arkansas’s neighboring states, and the second highest in the South (just below South Carolina’s 7.0 percent). This reduction brings Arkansas roughly in line with neighboring Missouri (5.9 percent) and Louisiana (6.0 percent), as well as Georgia and Kentucky (both at 6.0 percent). Neighboring Oklahoma and Mississippi are still slightly lower at 5.0 percent, and Texas and Tennessee have no income tax on wages and salaries, so there is still work to be done in the future. Ideally, future legislatures will work to further simplify the rate schedules, but this is a big step in the right direction.
Finally, these examples do not include other expected tax changes in Arkansas this legislative session. This bill is the first in a series of reforms planned by the General Assembly. The legislature is expected to consider reforms to its corporate income tax rate and tax base and changes to the state’s sales tax following the U.S. Supreme Court’s Wayfair decision, among other changes.
Calculation Assumptions
For our calculations, we used the Arkansas tax system as it exists on both January 1, 2015 and January 1, 2019. For the 2019 calculations, these are after the scheduled phase-in of the low-income tax changes effective on January 1. We assumed all filers used the standard deduction, for simplicity and comparisons (those though with itemized deductions will not see an increase, unlike previous versions of the plan). These calculations assume the rate structure under the “2/4/5.9% plan” when it’s fully phased in in 2021.
These calculations do not include any other tax changes, such as taxing online transactions under a sales tax, other sales tax base changes, or any business-side changes.
![]()
Source: Tax Policy – Implementing Phase Three of Individual Income Tax Cuts in Arkansas
by r Hampton | Jan 30, 2019 | Tax News
Tax Policy – What the U.S. Can Learn from the Adoption (and Repeal) of Wealth Taxes in the OECD
Recent discussions of a proposed wealth tax for the United States have included little information about trends in wealth taxation among other developed nations. However, those trends and the current state of wealth taxes in OECD countries can provide context for this new proposal.
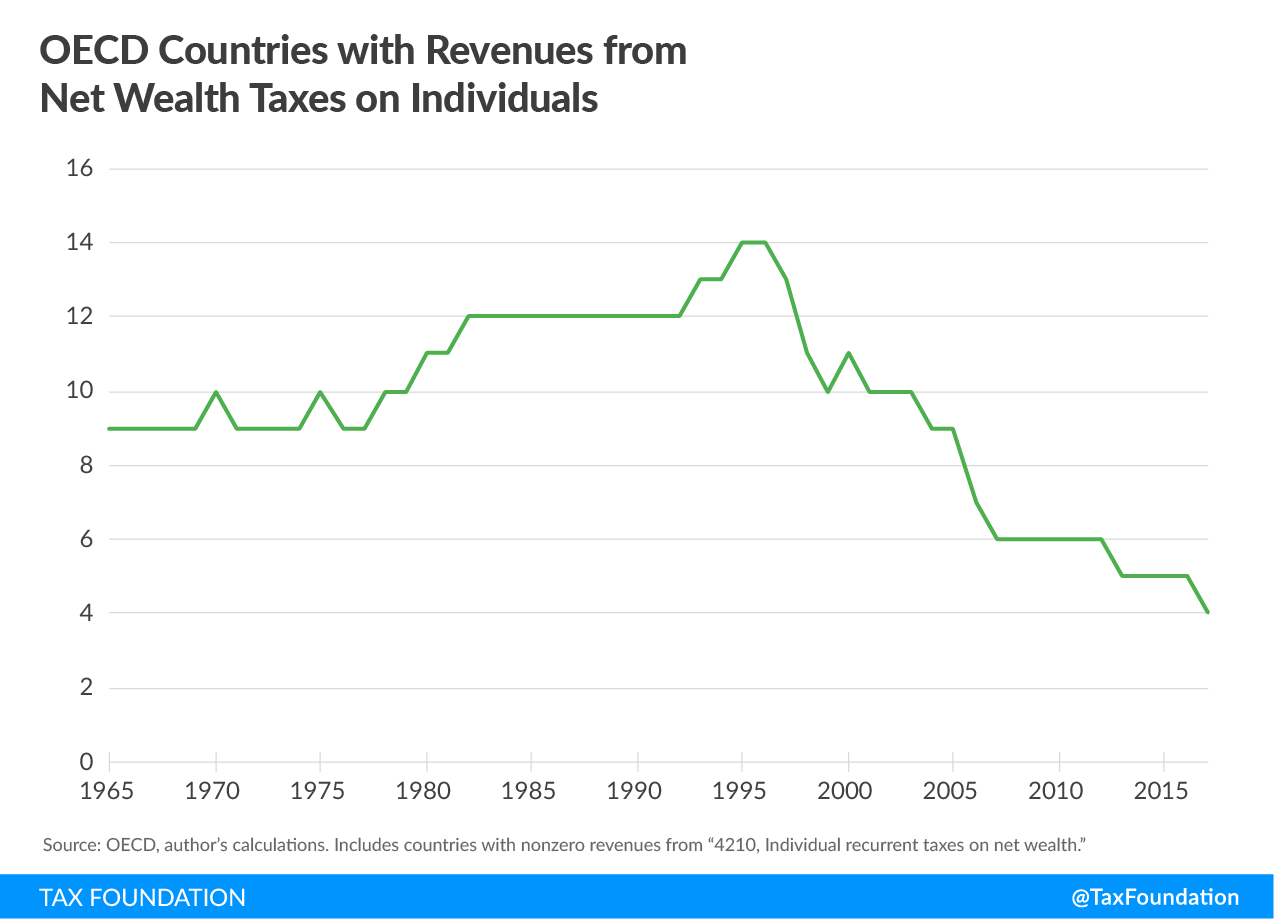
The OECD maintains detailed tax revenue statistics going back to 1965 for its 36 member countries. The data includes revenues from taxes on the net wealth of individuals.
According to these data, the number of current OECD members that have collected revenue from net wealth taxes has grown from nine in 1965 to a peak of 14 in 1996 to just four in 2017.

In the OECD data, the countries that collected revenues from net wealth taxes on individuals in 2017 are Switzerland, Spain, France, and Norway. Revenues from net wealth taxes made up 3.62 percent of revenues in Switzerland in 2017 but just 0.55 percent of revenues in Spain. Among those four OECD countries collecting revenues from net wealth taxes, revenues made up just 1.45 percent of total revenues on average in 2017.
In 2018, France dropped its net wealth tax, and Belgium introduced its own version of a net wealth tax.
An OECD report about wealth taxes argues that these taxes can harm risk-taking and entrepreneurship, harming innovation and impacting long-term growth. The report also suggests that a net wealth tax could spur investment and risk-taking. Essentially, the argument is that because a wealth tax would erode the after-tax return for an entrepreneur, that entrepreneur might engage in even riskier ventures to maximize a potential return. However, a wealth tax would be a particularly poor way to encourage risk-taking.
The revenue data from the OECD does not perfectly match the policy changes made by countries. For instance, Austria effectively repealed its net wealth tax in 1994, but revenues from the tax continued to trickle in until 2000. The OECD also conducted a survey of countries regarding their net wealth taxes and the trend for collecting revenues from net wealth taxes is similar to the survey responses.
Additionally, the OECD data definitions leave out two countries that currently administer a net wealth tax, although in unique ways. The Netherlands applies a tax on net wealth as part of its income tax, and Italy has a net wealth tax that applies to assets and property held abroad by Italian taxpayers. Including the Netherlands and Italy, there are six OECD countries that currently administer a net wealth tax on individuals.
Current OECD Countries with a Net Wealth Tax
|
Source: EY, Worldwide Estate and Inheritance Tax Guide
|
| Country |
Rate |
Base |
|
Belgium
|
0.15 percent
|
Average value of securities holdings if the value is greater than €500,000 ($571,000) per account holder.
|
|
Italy
|
0.2 percent for financial assets, 0.76 percent for real estate properties
|
Financial assets and real estate properties held abroad by Italian taxpayers.
|
|
Netherlands
|
0.61 percent to 1.61 percent (effective)
|
Net wealth excluding primary residence and substantial interests in companies. Part of the income tax.
|
|
Norway
|
0.7 percent at the municipality level and 0.15 percent at the national level
|
Fair market value of assets minus debt. Tax applies to value of wealth above NOK1.48 million ($174,400).
|
|
Spain
|
0.2 percent to 2.5 percent depending on the region
|
May differ depending on the region, but generally value of assets minus value of liabilities.
|
|
Switzerland
|
Varies depending on the Canton
|
Gross assets minus debts.
|
Some countries have unique exclusions to their wealth taxes. Italy’s net wealth tax has a provision where new Italian residents who relocate to Italy for tax purposes may not be subject to the wealth tax. In Spain, the net wealth tax effectively only applies to taxpayers who do not reside in Madrid, because the city provides 100 percent relief from the tax.
Over the years, countries have repealed their net wealth taxes for various reasons, but economic impact is included in those reasons. French Finance Minister Bruno LeMaire has made it clear that the repeal of the wealth tax in France is part of a reform package designed to “attract more foreign investment.” The French reform package also includes a planned reduction in the corporate tax rate.
The lessons from other countries’ experiences with wealth taxes should inform policymakers in the U.S. as they consider such a proposal. With so many countries having adopted and then abandoned a wealth tax, perhaps the U.S. should avoid adopting one in the first place.
![]()
Source: Tax Policy – What the U.S. Can Learn from the Adoption (and Repeal) of Wealth Taxes in the OECD

by r Hampton | Jan 30, 2019 | Tax News
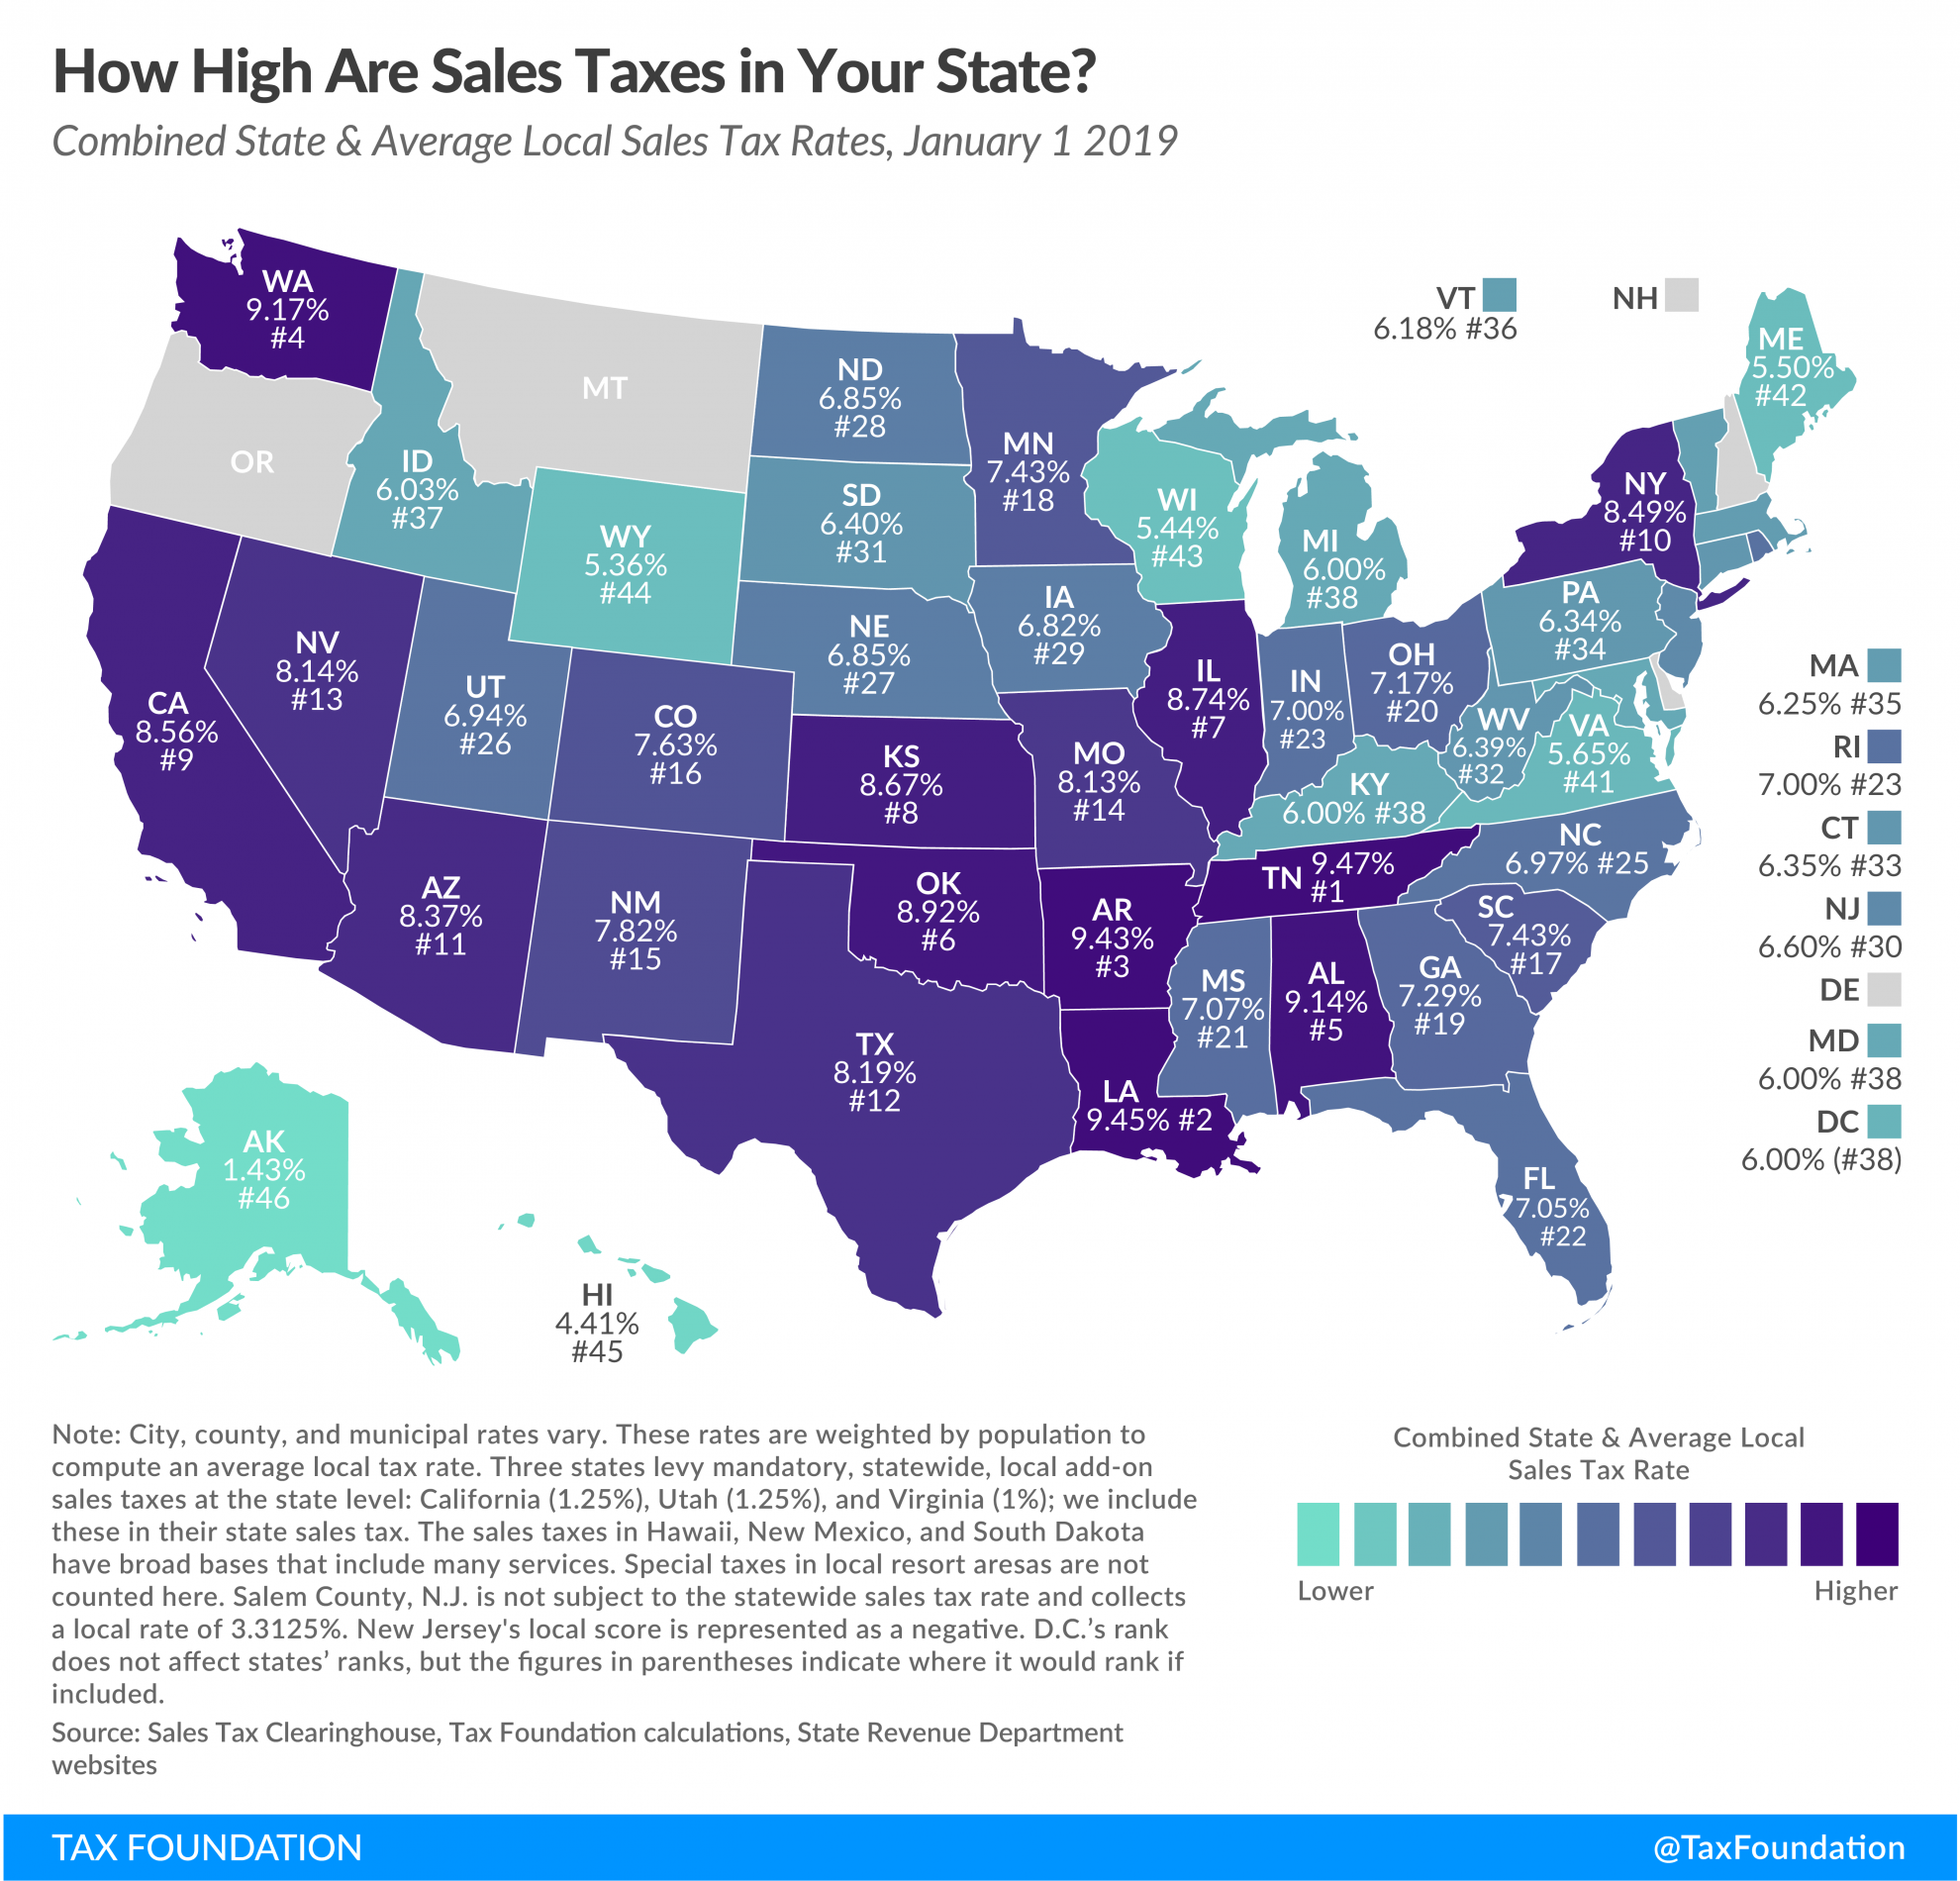
Tax Policy – State and Local Sales Tax Rates, 2019
Key Findings
- Forty-five states and the District of Columbia collect statewide sales taxes.
- Local sales taxes are collected in 38 states. In some cases, they can rival or even exceed state rates.
- The five states with the highest average combined state and local sales tax rates are Tennessee (9.47 percent), Louisiana (9.45 percent), Arkansas (9.43 percent), Washington (9.17 percent), and Alabama (9.14 percent).
- No state rates have changed since July 2018, when Louisiana’s declined from 5.0 to 4.45 percent.
- The District of Columbia’s sales tax rate increased to 6 percent from 5.75 percent.
- Sales tax rates differ by state, but sales tax bases also impact how much revenue is collected from a tax and how the tax affects the economy.
- Sales tax rate differentials can induce consumers to shop across borders or buy products online.
Introduction
Retail sales taxes are one of the more transparent ways to collect tax revenue. While graduated income tax rates and brackets are complex and confusing to many taxpayers, sales taxes are easier to understand; consumers can see their tax burden printed directly on their receipts.
In addition to state-level sales taxes, consumers also face local sales taxes in 38 states. These rates can be substantial, so a state with a moderate statewide sales tax rate could actually have a very high combined state and local rate compared to other states. This report provides a population-weighted average of local sales taxes as of January 1, 2019, to give a sense of the average local rate for each state. Table 1 provides a full state-by-state listing of state and local sales tax rates.
Combined Rates
Five states do not have statewide sales taxes: Alaska, Delaware, Montana, New Hampshire, and Oregon. Of these, Alaska allows localities to charge local sales taxes.[1]
The five states with the highest average combined state and local sales tax rates are Tennessee (9.47 percent), Louisiana (9.45 percent), Arkansas (9.43 percent), Washington (9.17 percent), and Alabama (9.14 percent). The five states with the lowest average combined rates are Alaska (1.43 percent), Hawaii (4.41 percent), Wyoming (5.36 percent), Wisconsin (5.44 percent), and Maine (5.50 percent).
State Rates
California has the highest state-level sales tax rate, at 7.25 percent.[2] Four states tie for the second-highest statewide rate, at 7 percent: Indiana, Mississippi, Rhode Island, and Tennessee. The lowest non-zero, state-level sales tax is in Colorado, which has a rate of 2.9 percent. Five states follow with 4 percent rates: Alabama, Georgia, Hawaii, New York, and Wyoming.[3]
No states have changed their statewide sales tax rates since July 2018, although the District of Columbia raised its sales taxes from 5.75 percent to 6 percent in October.[4]
Local Rates
The five states with the highest average local sales tax rates are Alabama (5.14 percent), Louisiana (5.00 percent), Colorado (4.73 percent), New York (4.49 percent), and Oklahoma (4.42 percent).
Average local rates rose the most in Florida, jumping the state from the 28th highest combined rate to the 22nd highest. The change was largely due to a 1 percent sales tax in Broward County and a 1.5 percentage-point local increase in Hillsborough County.[5] Colorado maintained its ranking, but saw 39 counties raise their sales taxes, including Central City’s increase from 4 percent to 6 percent at the start of 2019.[6]
Utah’s rank rose three spots, to 26th. This is largely due to Salt Lake County and Salt Lake City increasing their local sales taxes by and 0.25 and 0.5 percent, respectively.[7]
Nebraska saw the largest decrease in sales taxes this year, improving its combined state and local sales tax ranking by two spots. Lincoln drove this change by decreasing its sales tax from 1.5 percent to 1.0 percent, offsetting increases in a few smaller Nebraska municipalities.[8] While Wyoming’s ranking did not change, the state saw the year’s second-largest combined sales tax decrease when Carbon County’s 1 percent special purpose tax expired.[9]
It must be noted that some cities in New Jersey are in “Urban Enterprise Zones,” where qualifying sellers may collect and remit at half the 6.625 percent statewide sales tax rate (3.3125 percent), a policy designed to help local retailers compete with neighboring Delaware, which forgoes a sales tax. We represent this anomaly as a negative 0.03 percent statewide average local rate (adjusting for population as described in the methodology section below), and the combined rate reflects this subtraction. Despite the slightly favorable impact on the overall rate, this lower rate represents an implicit acknowledgment by New Jersey officials that their 6.625 percent statewide rate is uncompetitive with neighboring Delaware, which has no sales tax.
State & Local Sales Tax Rates as of January 1, 2019
(a) City, county, and municipal rates vary. These rates are weighted by population to compute an average local tax rate.
(b) Three states levy mandatory, statewide, local add-on sales taxes at the state level: California (1%), Utah (1.25%), and Virginia (1%). We include these in their state sales tax.
(c) The sales taxes in Hawaii, New Mexico, and South Dakota have broad bases that include many business-to-business services.
(d) Special taxes in local resort areas are not counted here.
(e) Salem County, N.J. is not subject to statewide sales tax rates and collects a local rate of 3.3125%. New Jersey’s local score is represented as a negative.
Note: D.C.’s ranks do not affect states’ ranks, but the figures in parentheses indicate where it would rank if included.
Source: Sales Tax Clearinghouse; Tax Foundation calculations.
|
| State |
State Tax Rate |
Rank |
Avg. Local Tax Rate (a) |
Combined Rate |
Rank |
Max Local Tax Rate |
| Ala. |
4.00% |
40 |
5.14% |
9.14% |
5 |
7.00% |
| Alaska |
0.00% |
46 |
1.43% |
1.43% |
46 |
7.50% |
| Ariz. |
5.60% |
28 |
2.77% |
8.37% |
11 |
5.60% |
| Ark. |
6.50% |
9 |
2.93% |
9.43% |
3 |
5.125% |
| Calif. (b) |
7.25% |
1 |
1.31% |
8.56% |
9 |
2.50% |
| Colo. |
2.90% |
45 |
4.73% |
7.63% |
16 |
8.30% |
| Conn. |
6.35% |
12 |
0.00% |
6.35% |
33 |
0.00% |
| Del. |
— |
46 |
0.00% |
0.00% |
47 |
0.00% |
| Fla. |
6.00% |
16 |
1.05% |
7.05% |
22 |
2.50% |
| Ga. |
4.00% |
40 |
3.29% |
7.29% |
19 |
5.00% |
| Hawaii (c) |
4.00% |
40 |
0.41% |
4.41% |
45 |
0.50% |
| Idaho |
6.00% |
16 |
0.03% |
6.03% |
37 |
3.00% |
| Ill. |
6.25% |
13 |
2.49% |
8.74% |
7 |
4.750% |
| Ind. |
7.00% |
2 |
0.00% |
7.00% |
23 |
0.00% |
| Iowa |
6.00% |
16 |
0.82% |
6.82% |
29 |
1.00% |
| Kans. |
6.50% |
9 |
2.17% |
8.67% |
8 |
4.00% |
| Ky. |
6.00% |
16 |
0.00% |
6.00% |
38 |
0.00% |
| La. |
4.45% |
38 |
5.00% |
9.45% |
2 |
7.00% |
| Maine |
5.50% |
29 |
0.00% |
5.50% |
42 |
0.00% |
| Md. |
6.00% |
16 |
0.00% |
6.00% |
38 |
0.00% |
| Mass. |
6.25% |
13 |
0.00% |
6.25% |
35 |
0.00% |
| Mich. |
6.00% |
16 |
0.00% |
6.00% |
38 |
0.00% |
| Minn. |
6.88% |
6 |
0.55% |
7.43% |
18 |
2.00% |
| Miss. |
7.00% |
2 |
0.07% |
7.07% |
21 |
1.00% |
| Mo. |
4.23% |
39 |
3.90% |
8.13% |
14 |
5.454% |
| Mont. (d) |
— |
46 |
0.00% |
0.00% |
47 |
0.00% |
| Nebr. |
5.50% |
29 |
1.35% |
6.85% |
27 |
2.00% |
| Nev. |
6.85% |
7 |
1.29% |
8.14% |
13 |
1.415% |
| N.H. |
— |
46 |
0.00% |
0.00% |
47 |
0.00% |
| N.J. (e) |
6.63% |
8 |
-0.03% |
6.60% |
30 |
3.313% |
| N.M. (c) |
5.13% |
32 |
2.69% |
7.82% |
15 |
4.125% |
| N.Y. |
4.00% |
40 |
4.49% |
8.49% |
10 |
4.875% |
| N.C. |
4.75% |
35 |
2.22% |
6.97% |
25 |
2.75% |
| N.D. |
5.00% |
33 |
1.85% |
6.85% |
28 |
3.50% |
| Ohio |
5.75% |
27 |
1.42% |
7.17% |
20 |
2.25% |
| Okla. |
4.50% |
36 |
4.42% |
8.92% |
6 |
6.50% |
| Ore. |
— |
46 |
0.00% |
0.00% |
47 |
0.00% |
| Pa. |
6.00% |
16 |
0.34% |
6.34% |
34 |
2.00% |
| R.I. |
7.00% |
2 |
0.00% |
7.00% |
23 |
0.00% |
| S.C. |
6.00% |
16 |
1.43% |
7.43% |
17 |
3.00% |
| S.D. (c) |
4.50% |
36 |
1.90% |
6.40% |
31 |
4.50% |
| Tenn. |
7.00% |
2 |
2.47% |
9.47% |
1 |
2.750% |
| Tex. |
6.25% |
13 |
1.94% |
8.19% |
12 |
2.00% |
| Utah (b) |
5.95% |
26 |
0.99% |
6.94% |
26 |
2.750% |
| Vt. |
6.00% |
16 |
0.18% |
6.18% |
36 |
1.00% |
| Va. (b) |
5.30% |
31 |
0.35% |
5.65% |
41 |
0.70% |
| Wash. |
6.50% |
9 |
2.67% |
9.17% |
4 |
3.90% |
| W.Va. |
6.00% |
16 |
0.39% |
6.39% |
32 |
1.00% |
| Wis. |
5.00% |
33 |
0.44% |
5.44% |
43 |
1.75% |
| Wyo. |
4.00% |
40 |
1.36% |
5.36% |
44 |
2.00% |
| D.C. |
6.00% |
(16) |
0.00% |
6.00% |
(41) |
0.00% |
The Role of Competition in Setting Sales Tax Rates
Avoidance of sales tax is most likely to occur in areas where there is a significant difference between two jurisdictions’ rates. Research indicates that consumers can and do leave high-tax areas to make major purchases in low-tax areas, such as from cities to suburbs.[10] For example, evidence suggests that Chicago-area consumers make major purchases in surrounding suburbs or online to avoid Chicago’s 10.25 percent sales tax rate.[11]
At the statewide level, businesses sometimes locate just outside the borders of high sales-tax areas to avoid being subjected to their rates. A stark example of this occurs in New England, where even though I-91 runs up the Vermont side of the Connecticut River, many more retail establishments choose to locate on the New Hampshire side to avoid sales taxes. One study shows that per capita sales in border counties in sales tax-free New Hampshire have tripled since the late 1950s, while per capita sales in border counties in Vermont have remained stagnant.[12] The state of Delaware actually uses its highway welcome sign to remind motorists that Delaware is the “Home of Tax-Free Shopping.”[13]
State and local governments should be cautious about raising rates too high relative to their neighbors because doing so will yield less revenue than expected or, in extreme cases, revenue losses despite the higher tax rate.
Sales Tax Bases: The Other Half of the Equation
This report ranks states based on tax rates and does not account for differences in tax bases (e.g., the structure of sales taxes, defining what is taxable and nontaxable). States can vary greatly in this regard. For instance, most states exempt groceries from the sales tax, others tax groceries at a limited rate, and still others tax groceries at the same rate as all other products.[14] Some states exempt clothing or tax it at a reduced rate.[15]
Tax experts generally recommend that sales taxes apply to all final retail sales of goods and services but not intermediate business-to-business transactions in the production chain. These recommendations would result in a tax system that is not only broad-based but also “right-sized,” applying once and only once to each product the market produces.[16] Despite agreement in theory, the application of most state sales taxes is far from this ideal.[17]
Hawaii has the broadest sales tax in the United States, but it taxes many products multiple times and, by one estimate, ultimately taxes 105.08 percent of the state’s personal income.[18] This base is far wider than the national median, where the sales tax applies to 34.25 percent of personal income.[19]
Methodology
Sales Tax Clearinghouse publishes quarterly sales tax data at the state, county, and city levels by ZIP code. We weight these numbers according to Census 2010 population figures to give a sense of the prevalence of sales tax rates in a particular state.
It is worth noting that population numbers are only published at the ZIP code level every 10 years by the U.S. Census Bureau, and that editions of this calculation published before July 1, 2011, do not utilize ZIP code data and are thus not strictly comparable.
It should also be noted that while the Census Bureau reports population data using a five-digit identifier that looks much like a ZIP code, this is actually what is called a ZIP Code Tabulation Area (ZCTA), which attempts to create a geographical area associated with a given ZIP code. This is done because a surprisingly large number of ZIP codes do not actually have any residents. For example, the National Press Building in Washington, D.C., has its own ZIP code solely for postal reasons.
For our purposes, ZIP codes that do not have a corresponding ZCTA population figure are omitted from calculations. These omissions result in some amount of inexactitude but overall do not have a palpable effect on resultant averages because proximate ZIP code areas which do have ZCTA population numbers capture the tax rate of those jurisdictions.
Conclusion
Sales taxes are just one part of an overall tax structure and should be considered in context. For example, Tennessee has high sales taxes but no wage income tax, whereas Oregon has no sales tax but high income taxes. While many factors influence business location and investment decisions, sales taxes are something within policymakers’ control that can have immediate impacts.
Notes
[1] Special taxes in Montana’s resort areas are not included in our analysis.
[2] This number includes mandatory add-on taxes which are collected by the state but distributed to local governments. Because of this, some sources will describe California’s sales tax as 6.0 percent. A similar situation exists in Utah and Virginia.
[3] The sales taxes in Hawaii and South Dakota have bases that include many services and so are not strictly comparable to other sales taxes.
[4] “District of Columbia Tax Rates Changes Take Effect Monday, October 1,” DC.gov, Sept. 5, 2018, https://otr.cfo.dc.gov/release/district-columbia-tax-rates-changes-take-effect-monday-october-1.
[5] “Florida (FL) Sales Tax Rate Changes,” Sale-tax.com, Jan. 1, 2019, http://www.sale-tax.com/Florida-rate-changes.
[6] “Colorado (CO) Sales Tax Rate Changes,” Sale-tax.com, Jan. 1, 2019, http://www.sale-tax.com/Colorado-rate-changes.
[7] “Utah Sales and Use Tax Rates,” Tax.utah.gov, Jan. 1, 2019, https://tax.utah.gov/sales/rates.
[8] “Changes in Local Sales and Use Tax Rates – Effective October 1, 2018,” Revenue.nebraska.gov, Oct. 1, 2018, http://www.revenue.nebraska.gov/news_rel/aug_18/Changes_in_Local_Sales_and_Use_Tax_Rates_10-1-2018.html.
[9] “Wyoming sales tax rate changes, October 2018,” Avalara.com, Sept. 14, 2018, https://www.avalara.com/taxrates/en/blog/2018/09/wyoming-sales-tax-rate-changes-october-2018.html.
[10] Mehmet Serkan Tosun and Mark Skidmore, “Cross-Border Shopping and the Sales Tax: A Reexamination of Food Purchases in West Virginia,” Research Paper 2005-7, Regional Research Institute, West Virginia University, September 2005, http://rri.wvu.edu/wp-content/uploads/2012/11/Tosunwp2005-7.pdf. See also T. Randolph Beard, Paula A. Gant, and Richard P. Saba, “Border-Crossing Sales, Tax Avoidance, and State Tax Policies: An Application to Alcohol,” Southern Economic Journal 64, no. 1 (July 1997): 293-306.
[11] Susan Chandler, “The sales tax sidestep,” Chicago Tribune, July 20, 2008, http://articles.chicagotribune.com/2008-07-20/business/0807190001_1_sales-tax-tax-avoidance-tax-landscape.
[12] Arthur Woolf, “The Unintended Consequences of Public Policy Choices: The Connecticut River Valley Economy as a Case Study,” Northern Economic Consulting, Inc., November 2010, http://www.documentcloud.org/documents/603373-the-unintended-consequences-of-public-policy.html.
[13] Len Lazarick, “Raise taxes, and they’ll move, constituents tell one delegate,” Marylandreporter.com, Aug. 3, 2011, http://marylandreporter.com/2011/08/03/raise-taxes-and-theyll-move-constituents-tell-one-delegate/.
[14] For a list, see Jared Walczak, Scott Drenkard, and Joseph Bishop-Henchman, 2019 State Business Tax Climate Index, Tax Foundation, Sept. 26, 2018, https://taxfoundation.org/publications/state-business-tax-climate-index/.
[15] Liz Malm and Richard Borean, “How Does Your State Sales Tax See That Blue and Black (or White and Gold) Dress?” Tax Foundation, Feb. 27, 2015, http://taxfoundation.org/blog/how-does-your-state-sales-tax-see-blue-and-black-or-white-and-gold-dress.
[16] Justin M. Ross, “A Primer on State and Local Tax Policy: Trade-Offs among Tax Instruments,” Mercatus Center at George Mason University, Feb. 25, 2014, http://mercatus.org/publication/primer-state-and-local-tax-policy-trade-offs-among-tax-instruments.
[17] For a representative list, see Jared Walczak, Scott Drenkard, and Joseph Henchman, 2019 State Business Tax Climate Index.
[18] John Mikesell, “State Retail Taxes in 2012: The Recovery Continues,” State Tax Notes (June 24, 2013): 1003.
[19] Id.
![]()
Source: Tax Policy – State and Local Sales Tax Rates, 2019


 TAXTIMEKC